Diminishing Risk Premium Amidst High Expectations
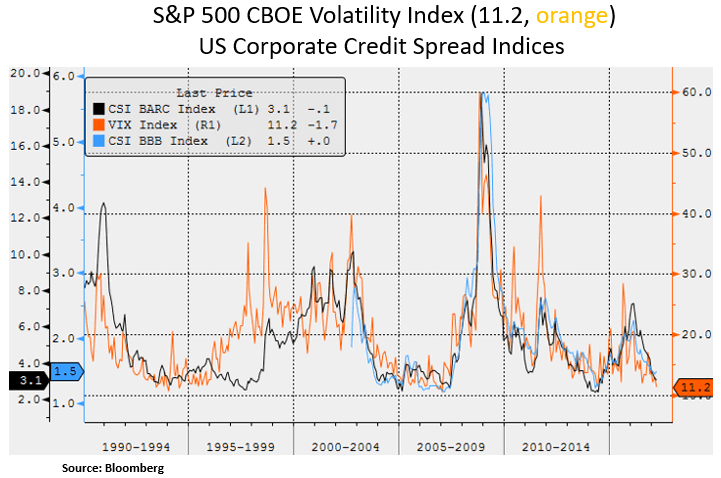
U.S. investors are navigating a backdrop that features asset prices near or at cycle highs on the back of elevated global reflationary expectations. Year-to-date, U.S. equities have performed as follows: S&P 500 +6.50%, DOW JONES +6.55% and NASDAQ +8.89%. Declining demand for portfolio hedging has suppressed implied S&P 500 volatility which is in the bottom 5% of its historical range. In U.S. equities, we note that global hedge fund beta exposure is near record highs. Moreover, NYSE margin employed increased the past few months and certain quantitative strategies (e.g. Volatility Targeting and Risk Parity portfolios) are positioned with high levels of US equity leverage, given the strong market momentum and low realized volatility. Therefore, investor demand for leveraged S&P 500 exposure has increased significantly. In corporate debt markets, historically tight credit spreads point to a dearth of risk premium. Lastly, recent (Feb) insider (CEO) sale transactions on the NYSE outnumbered their purchase transactions by more than 11 to 1, per Vickers. From our perspective, we remain focused on selective mega-cap equities that have resilient balance sheets and earnings profiles.
On the interest rate front, a few hawkish words from Federal Reserve doves (Duddley, Brainard) caused a sharp repricing of the prospects for a hike next week (15th Mar). As the Fed’s inflation and employment mandates are being fulfilled, the Fed has penciled 3 rate hikes for 2017. We note that leading indicators signal global growth beyond 3.5% in 2018. The pick-up in global growth in 2017-18 reflects the effect of ongoing and projected fiscal initiatives, notably in China and the U.S., together with an easier stance in the Eurozone. In addition, while global trade growth was exceptionally weak in 2016 at ~2%, recent data suggest improvement, particularly in Asia. The main investor challenge at this juncture is the underpricing of risk as we are at advanced stages in various cycles e.g. U.S. residential & commercial real estate cycles and the credit cycle (historically tight corporate spreads).


Since the U.S. equity bottom of Mar 9th 2009, investors have witnessed substantial global stimulus programs and meaningful U.S. share buyback activity (~$0.4-0.5 trillion/year). As we can see below, the Federal Reserve balance sheet expanded 5.5x, the Federal U.S. debt/GDP expanded >55% and Chinese credit/GDP expanded by ~90%. We also note that global private sector debt to GDP is at record highs and above the 20-year trend. Chinese credit creation deserves greater focus in our view, as 80% of the world’s private sector credit creation occurs in China. There is a question of sustainability as this resurgence in fiscal stimulus and credit faces a tightening bias by the PBOC and global Central Banks.


As of late, the global credit impulse is showing signs of deceleration. This will likely have implications for the pace of global growth and inflation expectations by year-end. Moreover, the M1-M2 Money supply ratio in China (shown in the right-hand chart below), has recently trailed off. Historically this ratio has functioned well as an indicator of GDP growth as it signals that corporates are building cash to invest in capital expenditure and other real economy projects. On a positive note, China’s supply side reforms have been successful in eliminating pockets of excess capacity, which has led to an exit from price deflation (PPI inflation now at +6.9%). Yet, in coming quarters, a slowing pace of credit creation is likely to lead to a trailing off in Chinese inflation metrics. From our investment perspective, as the Federal Reserve gears up on policy normalization, further increases in U.S. bond yields will likely create favorable entry points in interest rate sensitive asset classes. We would also be opportunistic as reflationary trades in cyclical equity sectors experience corrections. Moreover, a pause in the U.S. dollar rally will likely be favorable to U.S. multinationals e.g. in the tech, healthcare and energy sectors.


Lastly, we note that recent positive economic surprises in the US are mainly based on manufacturing and consumer confidence surveys rather than hard data. For example, the Atlanta Fed GDP Now Tracker points to only 1.3% GDP growth q-o-q, annualized in Q1, which is substantially below the levels indicated at the start of the year. The change was due to lower real personal consumption expenditures growth and real nonresidential equipment investment growth. Adjusting for personal consumption inflation, we also note that real wage growth has stalled. With a relatively tight U.S. labor market, we look forward to seeing how real wage growth impacts inflation adjusted borrowing costs i.e. real yields. A Fed induced rise in real interest rates will likely create buying opportunities across both the equity and fixed income asset spectrums.
In conclusion, investors are currently pricing in a firm global reflationary backdrop which has been further supported by U.S. pro-growth expectations since the Nov-2016 election. Risk premia however appear too low i.e. risks in both the equity and corporate bond markets appear underpriced. We look to be opportunistic as policy action (e.g. Fed tightening) or political events (e.g. European elections) create some mean reversion in asset price volatility. A further rise in U.S. real yields would create a better opportunity to deploy capital more aggressively.
Christos Charalambous CFA
Senior Strategist
christos.charalambous@edgewealth.com
Please remember that past performance may not be indicative of future results. Different types of investments involve varying degrees of risk, and there can be no assurance that the future performance of any specific investment, investment strategy, or product made reference to directly or indirectly in this newsletter (article), will be profitable, equal any corresponding indicated historical performance level(s), or be suitable for your portfolio. Due to various factors, including changing market conditions, the content may no longer be reflective of current opinions or positions. Moreover, you should not assume that any discussion or information contained in this newsletter (article) serves as the receipt of, or as a substitute for, personalized investment advice from Edge Wealth Management, LLC. To the extent that a reader has any questions regarding the applicability of any specific issue discussed above to his/her individual situation, he/she is encouraged to consult with the professional advisor of his/her choosing. A copy of our current written disclosure statement discussing our advisory services and fees is available for review upon request.