Runway Still Clear for Steady Fed Tightening
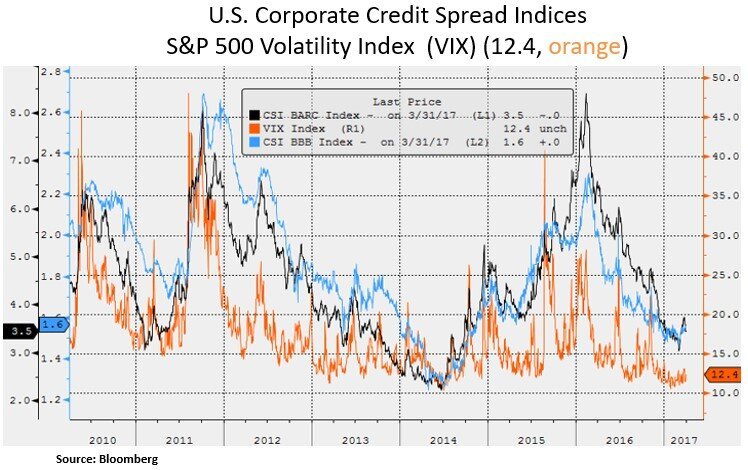
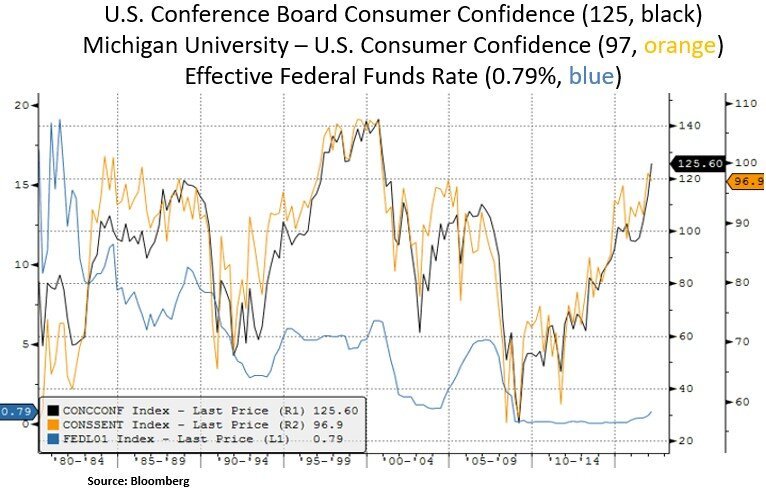
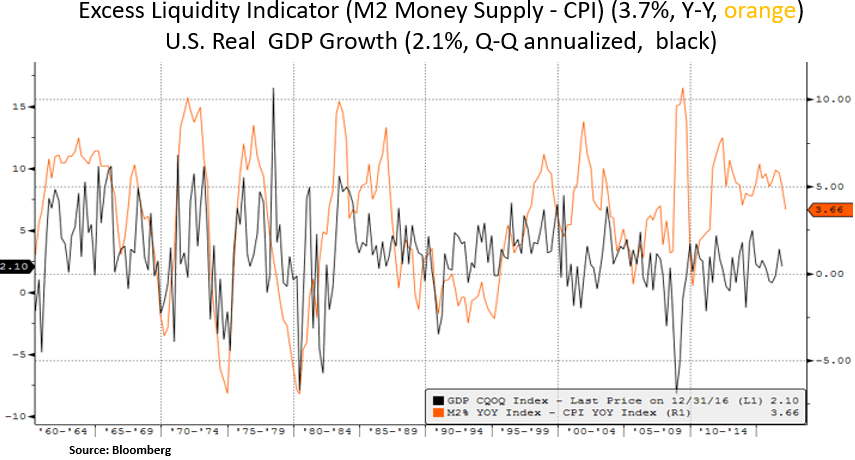
Financial markets are surfing on a wave of easy financial conditions, firm global cyclical data and U.S. tax reform expectations. U.S. manufacturing surveys in particular have indicated robust new orders and employment components. Consumer confidence hit a 16-year high in March and U.S. equity volatility (VIX index) had its lowest average quarter since Q4 2006. Year-to-date, U.S. equities have performed as follows: S&P 500 +5.8%, DOW JONES +5.1% and NASDAQ +9.9%. Market participants have been somewhat skeptical of the cyclical strength signals due to a record divergence between 'hard' (quantifiable) and 'soft' (sentiment) U.S. macro data. We expect an acceleration in headline GDP in Q2 to ~2.5% as real interest rates and credit spreads are now more stimulative today than when the Fed started hiking in Dec 2015. Moreover, energy sector credit risk measures remain low and the U.S. dollar is range bound. Looking ahead, global macro surprises seem to have peaked and the U.S. Treasury yield curve has been flattening in the past month with a notable decline in long-term yields – the latter move is partly the result of technical price action following extreme ‘short’ market positioning. We also note that the interest rate differential between the US and Germany is currently at 30-year highs, which makes U.S. Treasuries a relatively good ‘carry’ trade. In our view, easy financial conditions leave the window open for a ratcheting up of the Fed’s tightening rhetoric. Moreover, the Fed is poised to begin shrinking its $4.5-trillion balance sheet by Q4 of this year. Thus, from an investment perspective, we could witness better entry points in the fixed income spectrum and a pick-up in equity volatility. Our preference is for mega-cap equities e.g. in technology, healthcare and energy.
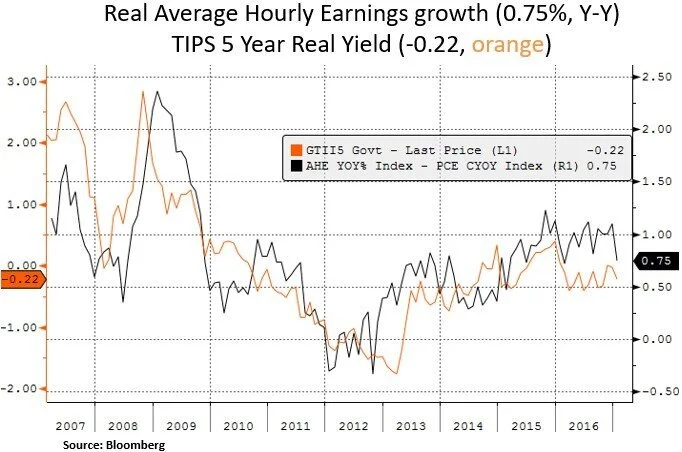
The Fed is likely facing a déjà vu moment, like the predicament faced by former Fed Chairman Alan Greenspan when he described a conundrum in February 2005 i.e. when the central bank was raising borrowing costs, long-term yields kept falling and equity markets rallied. In our view, the Fed has a renewed focus on ‘financial conditions’ metrics and despite the Fed’s recent rate hike in March, financial conditions have eased. Thus, more work needs to be done.


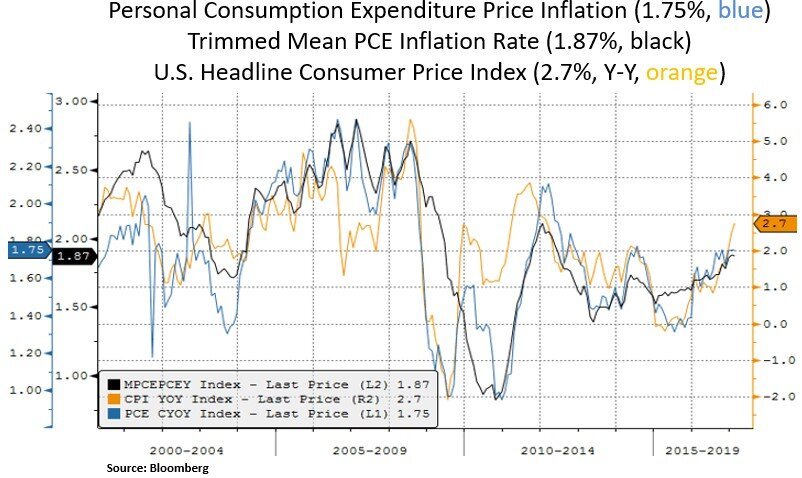
Apart from easy financial conditions, cyclical data also supports the Fed’s normalization path. The U.S. labor market is cyclically tight and inflation metrics are near the Fed’s target of ~2% inflation (on core PCE inflation). With record household wealth, high consumer confidence, recovering corporate profits and manufacturing momentum, the Fed has more market cover to continue on its policy normalization path. From our investment point of view, we need to see more volatility in interest sensitive and long duration instruments before we add to our exposures. Areas of interest would include utilities, preferred shares, REITS, municipal debt ETFs and credit sensitive cyclical equities.
Currently, our portfolio focus is tilted to secular growth themes within the technology and healthcare sectors; that will likely be prime beneficiaries of offshore cash repatriation e.g. Apple, CISCO, Microsoft and Pfizer. From a thematic point of view, we are still contructive on tech mega-trends such as cloud computing, big data analytics, and artificial intelligence e.g. via leading players such as Google and Microsoft. Regarding Cisco, we like the ongoing transition from hardware to software businesses, which bodes well for top-line growth and margin expansion. In the energy sector, we remain constructive on free cash flow recovery stories with names such as Chevron, BP and Exxon. For example, after years of heavy capital expenditures e.g. on mega LNG projects in Australia, we expect Chevron to enjoy strong free cash flow growth; which bodes well for a repricing of Chevron stock and capital returns via dividend increases and share buybacks.


Lastly, we note that economic surprise indicators are near their historic highs and may be showing signs of running their recent course. The Chinese economic surprise indicator has recently diverged and as discussed in recent notes the credit impulse has weakened on the margin. Chinese credit spreads are on the rise as the PBOC has recently engaged on a new wave of credit tightening measures and property restrictions. On the U.S. front, we continue to monitor leading liquidity and credit indicators. Any Chinese and/or Fed induced global liquidity dip will likely create better entry points in cyclically sensitive global equities e.g. within industrials and materials.
In conclusion, with a backdrop of historically elevated equity valuations, record insider selling and tight credit spreads, we remain selective and opportunistic in our capital allocation. We note that low intra-asset and intra-sector correlations create a conducive backdrop for individual stock selection. We look to be nimble as either fiscal or monetary policy missteps create favorable risk-reward opportunities across both the fixed income and equity spectrums.
Christos Charalambous CFA
Senior Strategist
christos.charalambous@edgewealth.com
Please remember that past performance may not be indicative of future results. Different types of investments involve varying degrees of risk, and there can be no assurance that the future performance of any specific investment, investment strategy, or product made reference to directly or indirectly in this newsletter (article), will be profitable, equal any corresponding indicated historical performance level(s), or be suitable for your portfolio. Due to various factors, including changing market conditions, the content may no longer be reflective of current opinions or positions. Moreover, you should not assume that any discussion or information contained in this newsletter (article) serves as the receipt of, or as a substitute for, personalized investment advice from Edge Wealth Management, LLC. To the extent that a reader has any questions regarding the applicability of any specific issue discussed above to his/her individual situation, he/she is encouraged to consult with the professional advisor of his/her choosing. A copy of our current written disclosure statement discussing our advisory services and fees is available for review upon request.