Global Central Banks Pivot to Dovish Stance
Financial markets continue to witness subdued asset price volatility. Markets expect the Fed to conclude its tightening stance by Q3 of 2019 by ending the decline of its balance sheet. Moreover, recent surveys (e.g. Caixin Manufacturing PMI) have pointed to a near-term bottom in the global economy led by China and global services activity. U.S/China trade tensions seem to be easing but as always, the devil is in the details. It remains to be seen how material and sustainable a final deal will be. With muted global inflation readings, global Central Banks are likely to tilt further on the dovish side. As such, global sovereign yields remain at historically low levels e.g. German 10 Year Bund yield at 0.17%. Peripheral sovereign European yields have also stayed in check in the past month; largely due to weak European growth. The 10 Year Treasury yield is largely unchanged for the month at 2.72%. The Treasury yield curve remains generally flattish with a small exception at the long-end (10-30 Year spread). For U.S. equities, the total return year-to-date is as follows: S&P 500 +11.6%, Dow Jones +11.2% and Nasdaq +14.5%.
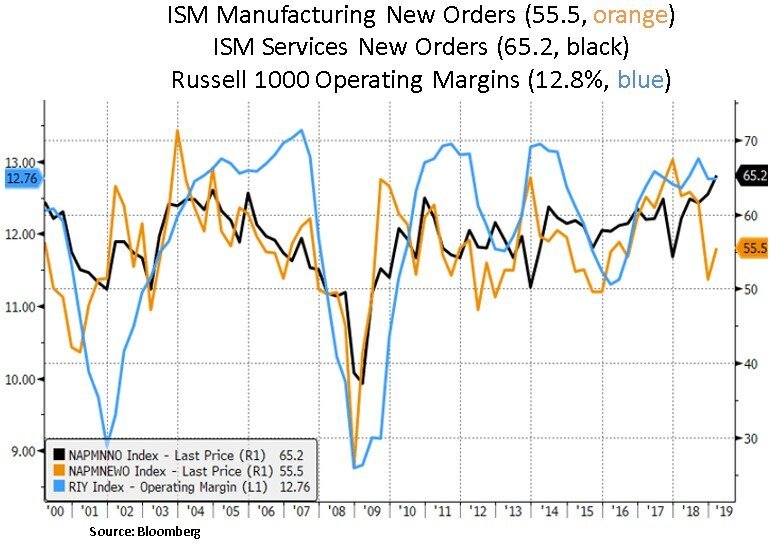
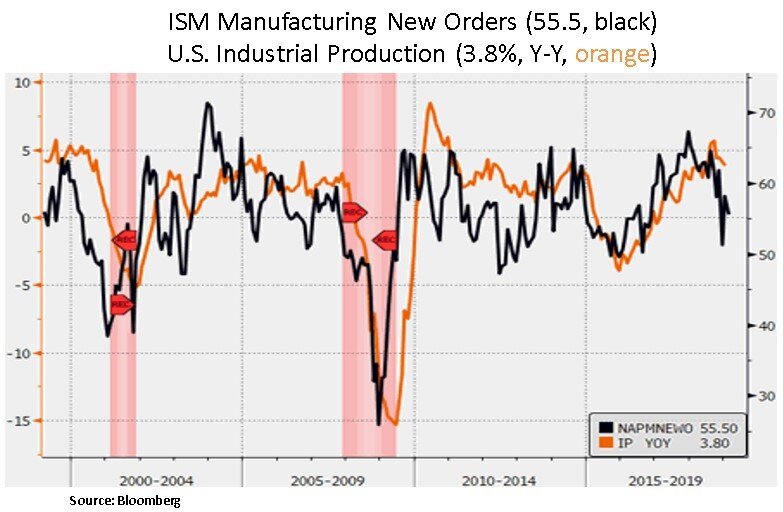
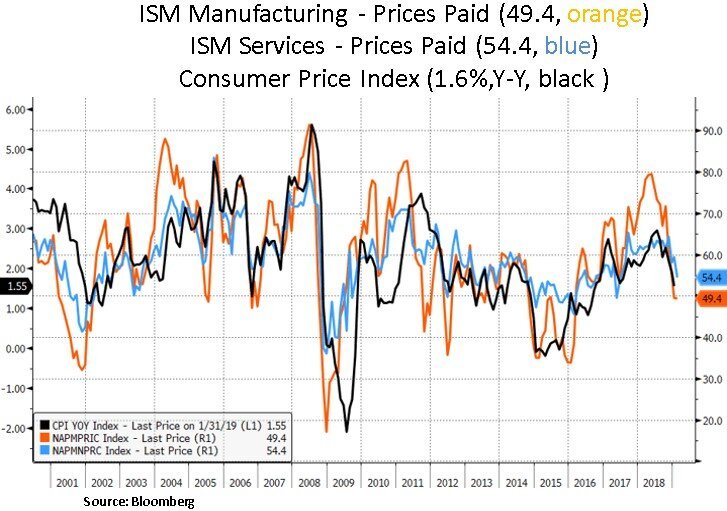
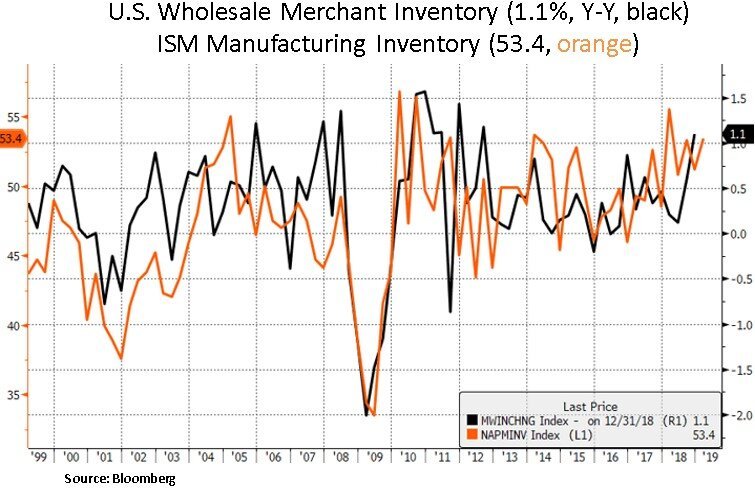
As we can see below, recent ISM surveys are pointing to U.S. growth stabilization. Particularly after a turbulent start to the year due to the U.S. government shutdown, global trade tensions and the whiplash of tightening financial conditions towards the end of 2018. We suspect there is still some inventory to be worked off in Q2 of 2019 that may keep pricing pressures in check. An uneven growth and pricing backdrop gives the Fed latitude to be dovish.
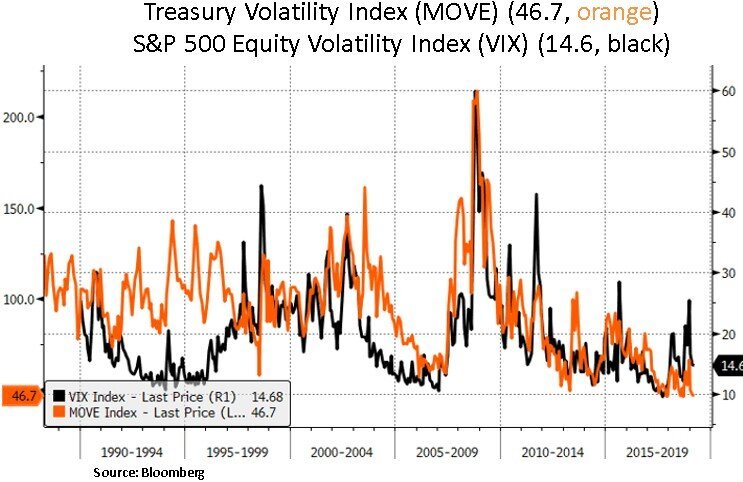
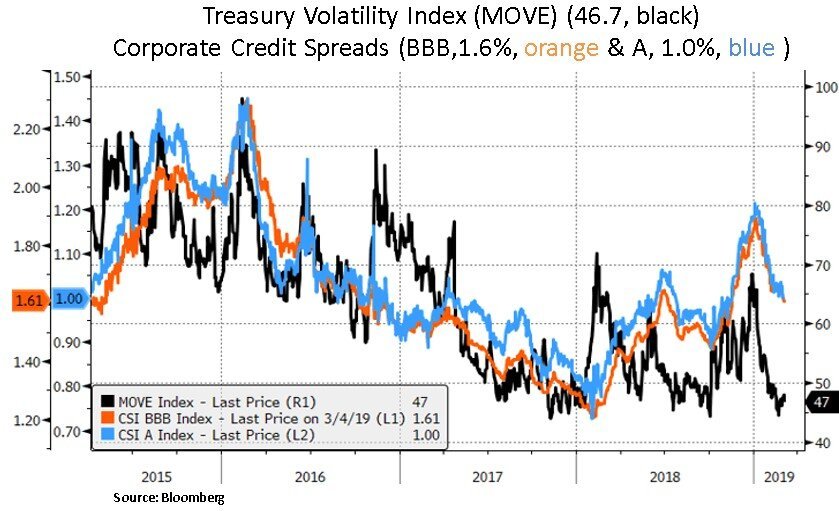
In the Treasury market, we note that interest rate volatility (MOVE index) hit a 30-year low. Along with the pull-back in ‘real’ rates, U.S. corporate spreads have remained tight. From a global perspective, we are seeing a synchronous tilt as both DM (developed markets) and EM (emerging market) Central Banks have turned dovish in recent months. With muted inflation in both DM and EM, we believe that Central Banks can continue to stay dovish, supporting financial conditions and growth. There are already strong indications for rate cuts by EM Central Banks. In China, there is growing optimism that China’s economy is bottoming supported by the jump in Total Social Financing (TSF), stimulus measures, a rebound in equity markets and the potential for a US-China trade deal. In addition, the market is expecting an improving liquidity backdrop based on the prospects of sizable capital inflows due to bond index inclusion and an increase in weighting of Chinese A-shares in the MSCI Emerging index.
From our perspective, earnings growth expectations have deteriorated materially over the past few months. The market is expecting an actual trough in S&P 500 EPS growth in 2Q19 or 3Q19 with more robust EPS growth in Q4 2019 and in the outer years i.e. 2020-21. In addition, consensus expects U.S. margins to expand 1% by 2021. Even though the bar has been lowered for the next few quarters, we believe there is some complacency in street EPS/revenue expectations over 2020-21. As a reminder, these long-term revenue and margin expectations drive equity valuations. As such, after a strong run year-to-date, we remain opportunistic in our security selection with a preference towards mega-cap corporations with strong balance sheets and sustainable earnings growth profiles.


Lastly, we note that while U.S. rate hikes are on pause, the Fed continues to shrink its balance sheet by US$50 billion per month. With financial conditions having loosened significantly since that December spike, the focus on the Fed is now on the potential for ending balance sheet contraction. The FOMC intends to announce a plan to stop reducing the Fed’s asset holdings. Such a plan could be unveiled as soon as the next FOMC meeting on 19-20th March. The need for a buffer of bank reserves of USD >1 trillion already suggests that the Fed’s balance sheet is shrinking to USD 3.5-3.7trillion vs. a tentative original estimate of USD 3.2trn.
On the other side of the pond, the question facing the ECB is whether balance sheet expansion will have to resume. FX markets have seen renewed weakness in the euro as investors continue to question the durability of growth in the old continent. The Eurostat reported that Eurozone real GDP rose by 1.2% YoY in 4Q18, down from 1.6% YoY in 3Q18 and a recent high of 2.8% YoY reached in 3Q17. We note that the ECB’s Balance sheet is now 41% of Eurozone GDP compared with only 20% for America. The latter is good news for U.S. investors as the Fed has more dry powder than all its peers in the event of a renewed growth downturn.


In conclusion, from our portfolio perspective, we continue to focus on quality balance sheets, sustainable earnings growth stories and income generation. At the sector level, we continue to like secular growth opportunities in technology, communication services, healthcare and selective large cap defensive names across all sectors. From a bottom-up perspective, we focus on free cash flow growth and credit quality. As consensus profit and margin expectations remain elevated for 2019-2021, we will likely have several stock picking opportunities throughout the year and as each earnings season unfolds.
Christos Charalambous CFA
Senior Strategist
christos.charalambous@edgewealth.com
Please remember that past performance may not be indicative of future results. Different types of investments involve varying degrees of risk, and there can be no assurance that the future performance of any specific investment, investment strategy, or product made reference to directly or indirectly in this newsletter (article), will be profitable, equal any corresponding indicated historical performance level(s), or be suitable for your portfolio. Due to various factors, including changing market conditions, the content may no longer be reflective of current opinions or positions. Moreover, you should not assume that any discussion or information contained in this newsletter (article) serves as the receipt of, or as a substitute for, personalized investment advice from Edge Wealth Management, LLC. To the extent that a reader has any questions regarding the applicability of any specific issue discussed above to his/her individual situation, he/she is encouraged to consult with the professional advisor of his/her choosing. A copy of our current written disclosure statement discussing our advisory services and fees is available for review upon request.