Growth and Earnings Need to Validate the Goldilocks Narrative
Financial markets have witnessed a material downshift in global sovereign yields in the past month. The culprits include a slew of negative global economic/inflation surprises (e.g. weak European manufacturing data) and a material dovish pivot by the Federal Reserve. The Fed appears to have convinced bond market participants there will be no further rate hikes during this economic cycle. This caused front-end of the Treasury curve inversions (e.g. 10 Year Treasury – 3-month bill spread). In the past month, the 10 Year Treasury yield declined by 0.27% to 2.48%. In Europe, the 10 Year German Bund declined by 0.23% to -0.05%. On a global basis, the amount of negative yielding sovereign debt has increased from $5.7 trillion in Q4 2018 to $9.9 trillion currently. In our view, three factors have supported the YTD rally in U.S. equities A. the Fed’s material policy shift, B. expectations for a U.S.- China trade deal, C. an expectation for a global growth rebound. In the past few days, Chinese and U.S. manufacturing readings have pointed to global growth stabilization. Lastly, U.S. equity volatility and U.S. corporate credit spreads remain in check.
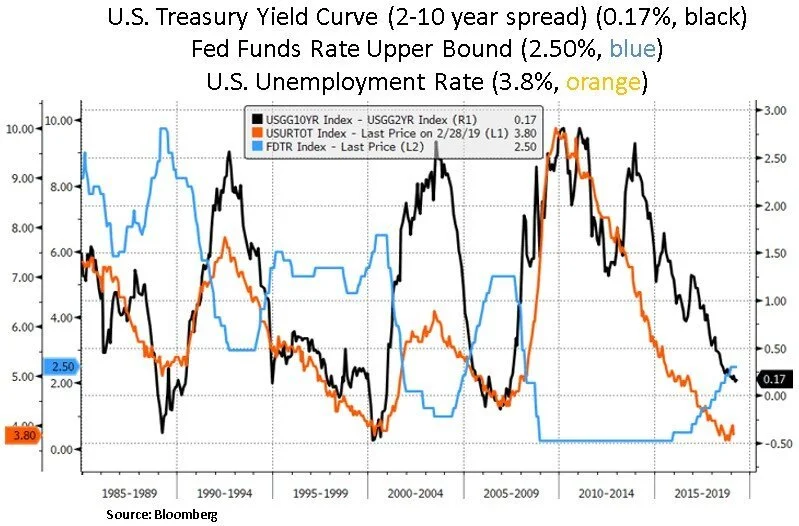
In recent weeks, ample digital ink has been spilled regarding the recessionary signal that the U.S. yield curve may be sending. Recession usually arrives a year or more after yield curve inversion and is signaled by a rapid bull steepening of the Treasury curve (i.e. front end of the curve yields falling faster than long-term yields). From our lens, there are several indicators flashing a late-cycle backdrop e.g. a tight labor market and a closing output gap. The challenge is that there may be a considerable lag between yield curve inversion and an actual recession; and risk assets can be resilient for a little while. We note that historically when the Fed starts cutting interest rates, a recession follows within a few months. The market is currently assigning a 62% probability of a rate cut by Dec 2019.


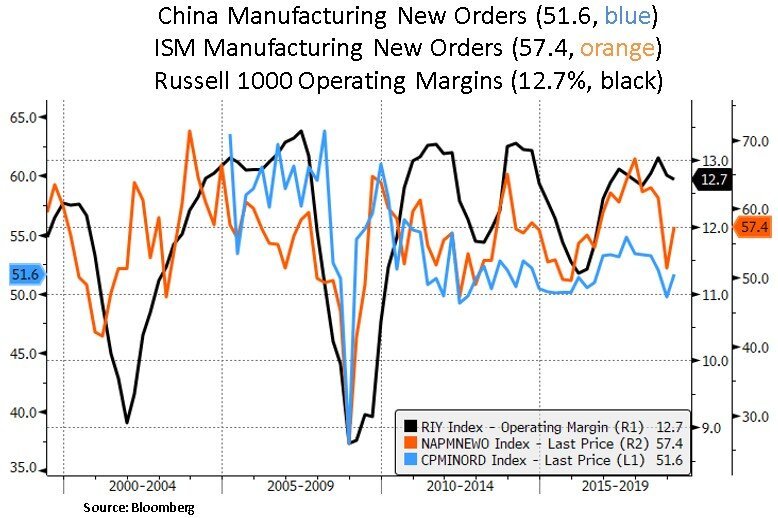
On a more positive note, rebounding Chinese and U.S. manufacturing data are starting to alleviate global growth concerns despite ongoing Eurozone weakness. Protracted U.S.-Sino negotiations have likely contributed to the weak global trade backdrop. Domestically however, a greater allocation of credit to the Chinese private sector is likely to improve credit allocation efficiency. Around 80% of credit had been going to state owned enterprises (SOEs). As of late, China has pledged to increase loans to small and medium sized businesses (SMEs) in the private sector from big commercial banks by more than 30%; this compares to a bank loan growth rate of 12.5% in 2018. China’s deleveraging campaign has hit SMEs the hardest, as they rely heavily on off-balance sheet financing. Therefore, there’s some scope for China’s credit multiplier and thus global growth to improve.
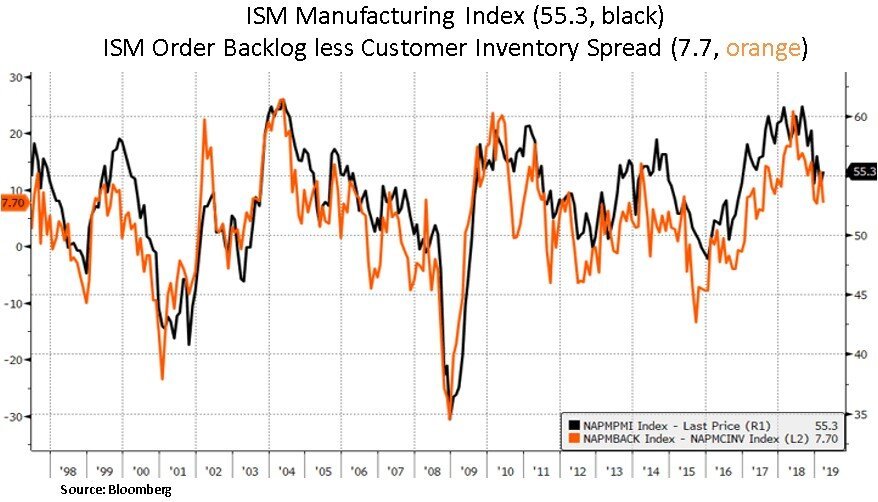
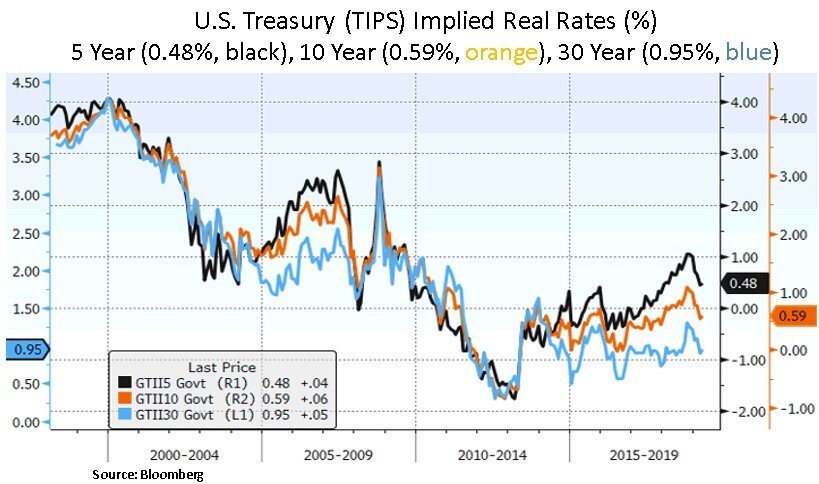
On the U.S. front, we note that most ISM manufacturing components have improved in the recent April report e.g. new orders, employment and prices paid. Perhaps less encouraging was the spread between the backlog of orders and customer inventories. Moreover, a few indicators have been pointing to inventory accumulation in Q1 2019. This may be a U.S. GDP headwind in subsequent quarters. On the other hand, as we can see below, other cyclical indicators such as crude oil have been supportive of the recent rebound in inflation expectations. We also note that the steep decline in real rates is generally supportive of financial conditions.

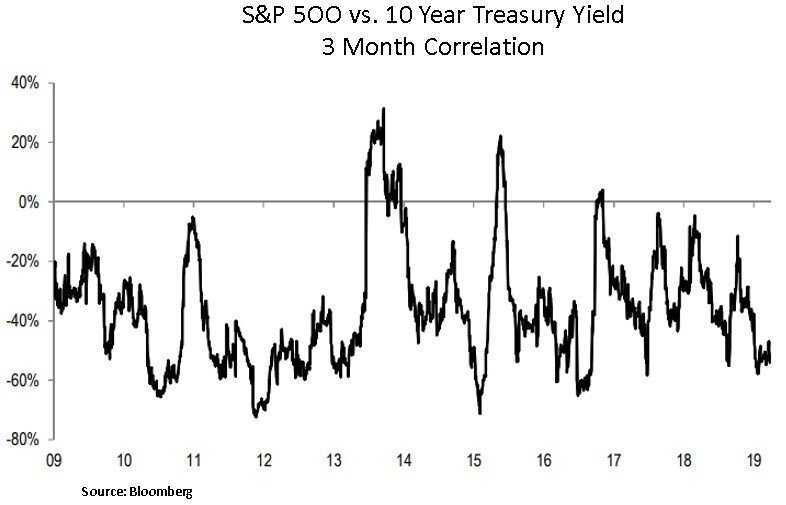
Lastly, we note that since the Fed’s recent FOMC meeting there has been a decoupling between bond yields and equities i.e. U.S. equities have been rallying with a decline in Treasury yields. Hence, there has been a restoration in the positive correlation between fixed income and equity prices. The stock-to-bond correlation has been observed to be well associated with the level of inflation. The recent inflection point, where the correlation between yields and stocks goes into reverse signifies a change in mindset from an inflationary to a deflationary mindset. This is consistent with the Fed’s further policy pivot and yield curve inversion signals. Bottom line – one should be mindful for bond-stock correlation flips (e.g. 2013-14 seen below) as it tends to precede a material pick-up in equity volatility.
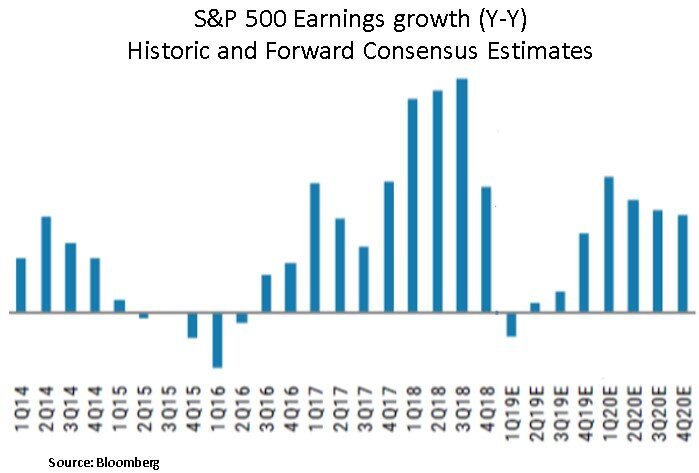
In conclusion, after a strong YTD performance in U.S. equities, we believe economic data and company earnings need to validate the current risk sentiment and subdued volatility backdrop. As we are about to enter U.S. earnings season, we note that the quarterly 2019 EPS expectations have been lowered by sell-side analysts. From our perspective (and as seen above), the consensus EPS growth in the 2020 timeframe seems to be on the high side. As asset prices seem fair at current levels and the business cycle continues to mature, the onus is on company management teams to meet these elevated expectations. In terms of our portfolio construction, we continue to focus on income generating instruments and single security selection; with micro catalysts and a margin of safety in terms of valuation.
Christos Charalambous CFA
Senior Strategist
christos.charalambous@edgewealth.com
Please remember that past performance may not be indicative of future results. Different types of investments involve varying degrees of risk, and there can be no assurance that the future performance of any specific investment, investment strategy, or product made reference to directly or indirectly in this newsletter (article), will be profitable, equal any corresponding indicated historical performance level(s), or be suitable for your portfolio. Due to various factors, including changing market conditions, the content may no longer be reflective of current opinions or positions. Moreover, you should not assume that any discussion or information contained in this newsletter (article) serves as the receipt of, or as a substitute for, personalized investment advice from Edge Wealth Management, LLC. To the extent that a reader has any questions regarding the applicability of any specific issue discussed above to his/her individual situation, he/she is encouraged to consult with the professional advisor of his/her choosing. A copy of our current written disclosure statement discussing our advisory services and fees is available for review upon request.