Late cycle U.S. labor dynamics at play
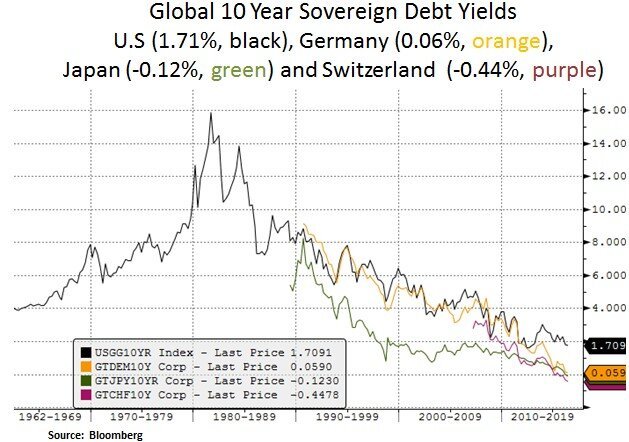
Financial market participants are currently witnessing a round trip in Fed tightening expectations. After a weak May U.S. jobs report, global sovereign yields remain in check and corporate credit spreads have tightened. As the Fed appears to be hitting the pause button on policy normalization, U.S. dollar strength remains in check as well. Oil supply disruptions (e.g. Nigeria) have kept global oil prices above $50. As a reminder, Brent/WTI prices hit $28/$26 respectively in Jan/Feb. Recovery in oil prices is critical for the global capital expenditure cycle and credit conditions. We have had overweight positions in the energy and industrial sectors. On the U.S. equity front, near-term volatility measures remain low (e.g. VIX at 13.5) and the S&P 500 is only ~1% from its all-time high (2118 vs 2134). Year-to-date, the S&P 500/NASDAQ/DOW have performed as follows: +3.3%/-0.78%/3.2% respectively. The 10 Year Treasury currently yields 1.7% vs. suppressed sovereign 10 Year yields in Germany & Japan i.e. 0.05% and -0.13% respectively. Such a yield backdrop is still constructive for income generating themes. We retain our bias for steady income generation from fixed income instruments, preferred shares and selective large-cap equities with a history of dividend growth.
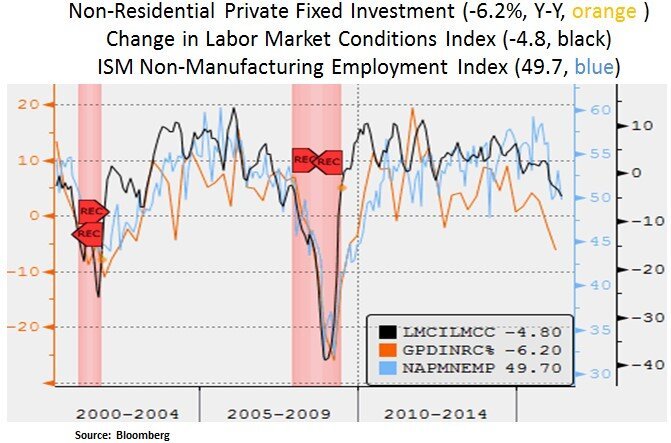
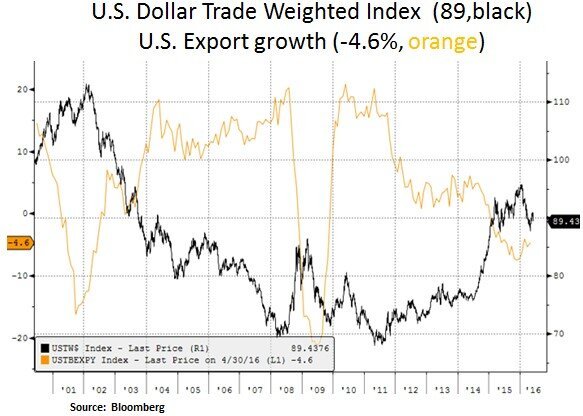
Investor sentiment is currently benefiting from reduced fears of a Fed policy mistake. The recent May jobs report and other regional surveys have indicated broad based softness in the U.S. labor market. Despite a 4.7% unemployment rate, labor force participation declined and softness has seeped to the services segment of the labor market. In addition, the labor force contracted (-458k) and involuntary part-time workers increased by 468k. In our view, corporations are responding to low productivity trends, high unit labor costs and a subpar investment backdrop. The latter may be a residual factor from earlier USD strength and the downturn in the energy sector. With this cyclical uncertainty, we expect the Fed normalization cycle to be very gradual; thus supporting income themes and U.S. multinationals exposed to a softer USD. We favor leaders in the technology and healthcare sectors.

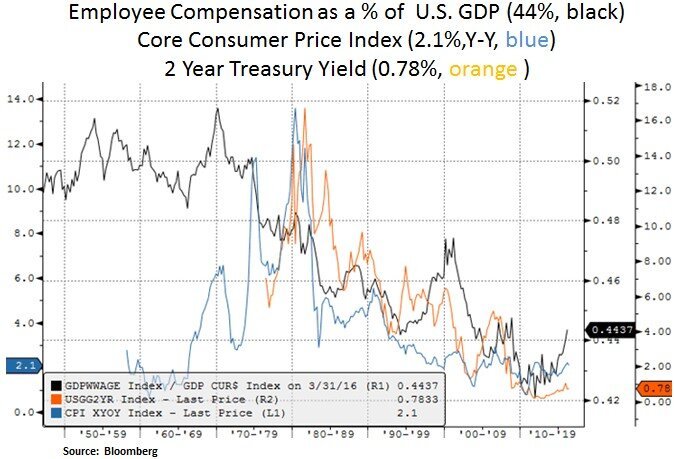
On the inflation front, the question is whether a slower labor force expansion will take the wind off recently rising U.S. wages. Weak productivity growth (output growing slower than hours worked) is an issue as higher unit costs dent profits. The consumer discretionary sector is most exposed to rising wages due to high exposure to minimum wage jobs e.g. restaurants/retail/leisure and hospitality. As political pressure is rising for increases to the minimum wage, we have been avoiding exposure to segments of the consumer discretionary sector that have high labor intensity and weak pricing power. Earnings estimates in the sector assume expanding corporate profitability, which lower productivity or higher labor costs would make less likely. We retain our underweight stance in the sector.
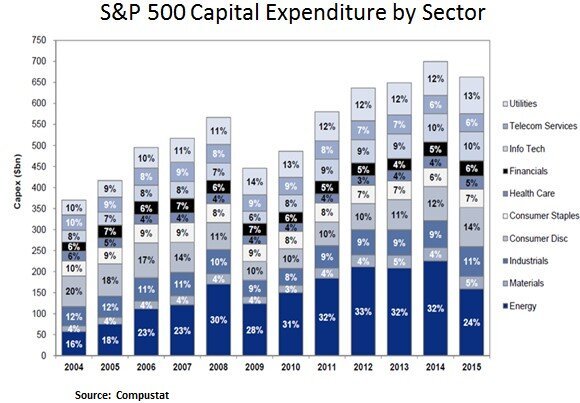
In contrast, we remain constructive on the energy sector and selective industrial names. The energy sector has gone through sizable jobs cuts and a pull-back in capital expenditures (good for free cash flow). As supply/demand rebalancing takes place in the energy sector, margins will likely recover as the cyclical downturn ends. Energy spending recovery bodes well for industrials. As you can see below, energy/materials/industrials/utilities account for 53% of S&P 500 capital expenditures. Even though we have been constructive on the recent oil price recovery, we also believe upside risk is likely capped in the $50-70 zone as this is the ‘sweet spot’ for North American shale oil producers. Apart from labor cost cutting, energy producers have also been focusing on more efficient horizontal drilling techniques e.g. longer lateral wells. This means marginal costs are coming down, which in turn can keep a lid on WTI prices. Therefore, we do not expect an oil driven jump in long-term inflation expectations.
From a big picture perspective, even if we assume a range-bound growth/inflation backdrop, the question is whether the negative sovereign yield backdrop can persist and for how long. Central Bank asset purchases have certainly played a big factor in distorting global sovereign debt markets and price discovery. Perhaps the more pragmatic approach is to look beneath the hood at the corporate debt level. U.S. non-financial debt has increased by $2 trillion USD since the 2008 financial crisis. Leverage metrics have been deteriorating on the margin but do not seem to be at levels of excessive concern.
As the business and market cycle matures, we will likely not see the same pace of private debt growth. This will likely impact the pace of share buybacks and overall pace of capital spending decisions e.g. M&A. The healthcare sector has been a fairly big debt issuer as a result of industry consolidation. The sector benefits from firm earnings outlooks and secular demand tailwinds due to global demographics. It is worth noting that 16 companies account for 50% of net debt issuance in 2015 and 44 companies account for 80%. Mega-cap technology and healthcare companies account for the bulk of this debt issuance e.g. Apple, Microsoft, UnitedHealth and Medtronic. Therefore, even though the pace of debt creation is a concern, we are not concerned about systemic default risk; as the bulk of the debt is held by lower risk mega-cap corporations in sectors with higher margins, high interest coverage ratios and high free cash flow yields.


In conclusion, we expect the Fed to continue to proceed with caution as the business and credit cycles mature. In a relatively low return environment, we continue to be selective capital allocators with a bias towards sustainable income generation and secular growth themes.
Christos Charalambous CFA
Senior Strategist
christos.charalambous@edgewealth.com
Please remember that past performance may not be indicative of future results. Different types of investments involve varying degrees of risk, and there can be no assurance that the future performance of any specific investment, investment strategy, or product made reference to directly or indirectly in this newsletter (article), will be profitable, equal any corresponding indicated historical performance level(s, or be suitable for your portfolio. Due to various factors, including changing market conditions, the content may no longer be reflective of current opinions or positions. Moreover, you should not assume that any discussion or information contained in this newsletter (article) serves as the receipt of, or as a substitute for, personalized investment advice from Edge Wealth Management, LLC. To the extent that a reader has any questions regarding the applicability of any specific issue discussed above to his/her individual situation, he/she is encouraged to consult with the professional advisor of his/her choosing. A copy of our current written disclosure statement discussing our advisory services and fees is available for review upon request.