Global yield backdrop pulls U.S. rates
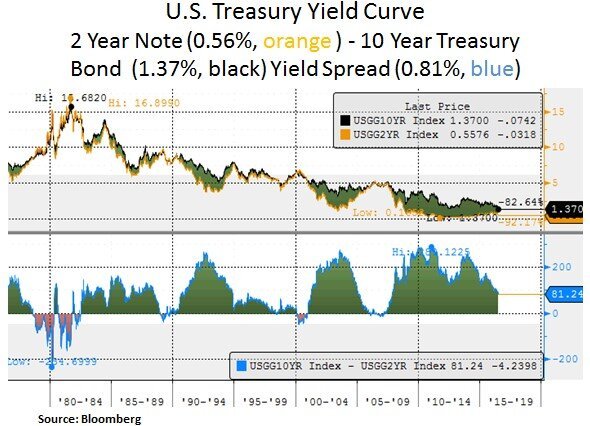
Investors are witnessing the continuing record plunge in G7 government bond yields, which accelerated after the UK chose to leave the EU on June 23rd. Nearly US$12 trillion worth of sovereign bonds currently have negative yields. The U.S. yield curve continues to flatten to 2007 levels, as previous consensus expectations of Federal Reserve tightening have declined dramatically and global growth concerns linger. In the past month, the U.S. 10 Year Treasury yield has declined by 0.38% to 1.39%. Peer sovereign yields such as the 10 Year German Bund and the Japanese (JGB) bond yield -0.18% and -0.27% respectively. In addition, the entire Swiss yield curve is now in negative yield territory. The challenge for investors is to discern the inherent signals from this collapse in government bond yields. Should we expect a protracted period of deflation and subdued growth? Or are Central Bank policies and high demand for liquid sovereign debt simply distorting price discovery and the pricing of risk? Probably the truth lies somewhere in the middle. From a portfolio perspective, the recent decline in real interest rates lends further support to income generating financial instruments. We continue to assess risk/reward scenarios on income themes and we seek to allocate capital to attractively valued instruments that offer sustainable cash flow e.g. in the healthcare and technology sectors.
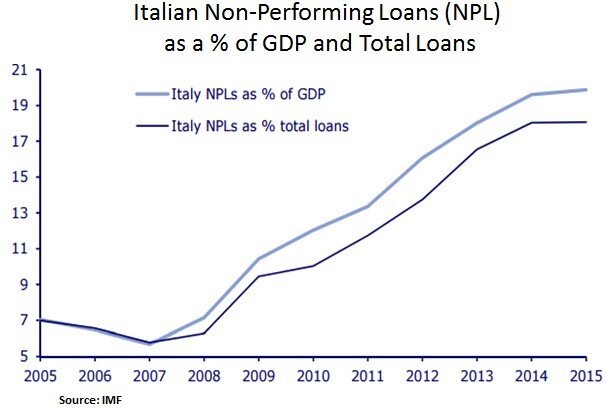
The Brexit impact on U.S. stocks is likely to be a modest negative. On the one hand, near-term and long-term UK/Europe earnings profile is likely to be negatively impacted by anti-establishment/anti-EU political turmoil. On the other hand, U.S. equities benefit from USD seeking capital flows and a Federal Reserve on hold for longer. Renewed volatility in the European Banking sector (e.g. RBS -53%, Barclays -30%, Deutsche Bank -28% since Brexit) is likely to be another parameter for the Fed’s global financial conditions dashboard. We also note that the Italian banking system is coming under the market’s focus, as non-performing loans need to be dealt with and EU 2016 bail-in rules are causing political friction between Rome and the EU.


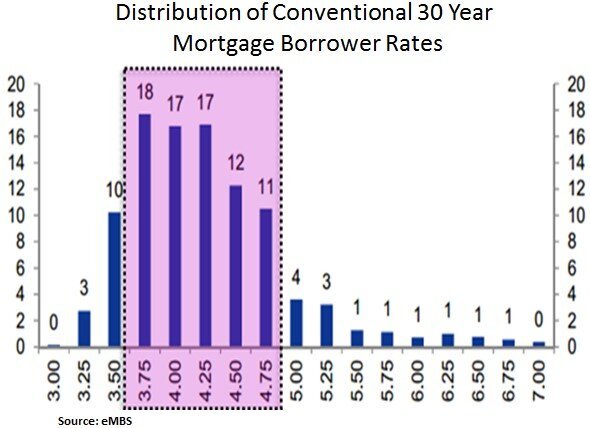
On a positive note, U.S. housing is a likely beneficiary of the global plunge is sovereign yields. Mortgage rates are close to all-time lows after Brexit i.e. at 3.39% vs. a historic low of 3.31% (Nov 2012) on a conventional 30 year mortgage. A large share of mortgage borrowers is likely on the cusp of further refinancing. Over 65% of current 30-year mortgage borrowers have note rates between 3.75% and 4.75%. Prepayments on borrowers with high note rates (> 5.0%) are not very sensitive to changes in interest rates, as these borrowers are already far in-the-money to refinance. Borrowers with note rates below 3.25% are out-of-the money to refinance, and are also insensitive to small rate moves. The borrowers who are now slightly in-the-money are most sensitive to rate changes. Therefore, low mortgage rates should support home sales and refinancing volume this summer.
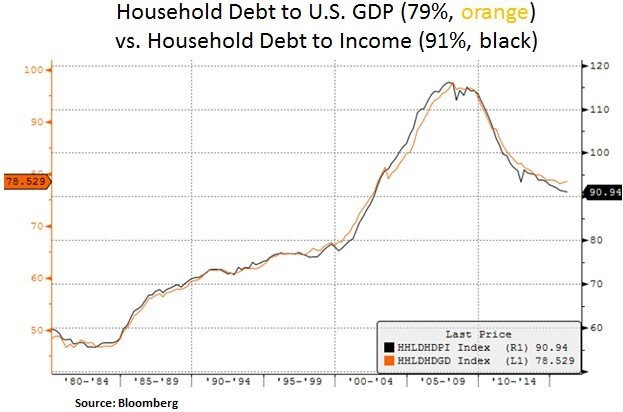
The Mortgage Bankers Association (MBA) is forecasting a 46% jump in 2Q 2016 mortgage originations with refis (+49%) and purchase (+42%) higher. The decline in primary rates will lead to increased agency MBS issuance. Legacy RMBS (residential MBS) voluntary prepayments are trending up on a slowly improving housing market. Broad non-agency severities (the % of lost principal when a loan is foreclosed) remain elevated but jumbo prime severities are lower than other sectors, due to larger loan sizes and lower exposure to judicial foreclosure states. Severities are high in states with long foreclosure timelines and small loan balances. The recent drop in mortgage rates and rising housing prices are likely to be most beneficial to households that were previously considered to have underwater mortgages. Fast-rising home prices brought 1.5 million borrowers up from underwater on their mortgages in 2015. In total, 3.2 million homeowners nationally still owe more on their mortgages than their homes are currently worth. The average negative equity rate is 6.5%. Moreover, low rental vacancy rates and rising rents may also encourage households to switch to home purchasing. Further recovery in the U.S. housing market is positive for U.S. GDP growth and lower mortgage rates are likely to unlock some disposable income for consumers.
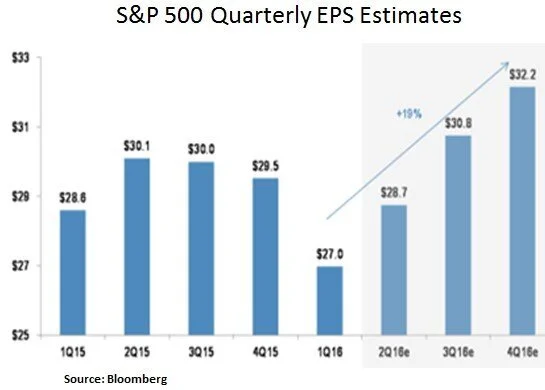
Lastly, after a burst of equity volatility, U.S. equities have recovered most of the ground lost after June 23rd (-5.3%). Year-to-date, U.S. equity performance (total return) is as follows: S&P 500 +3%, NASDAQ -2.8% and Dow Jones +3.7%. We note that post the Brexit vote, street earnings estimates have been trimmed after being broadly elevated. We remain selective as broad valuation levels remain full. As we approach earnings season on July 18th, we are keen to listen to CEO expectations with regard to capital expenditures and global growth expectations. We continue to lean on mega-cap equities with solid balance sheets and more robust cash flow profiles.


In conclusion, the current market backdrop has brought us in unchartered waters as a result of the historic drop in G7 sovereign bond yields. On the positive side, lower real interest rates are supportive of asset prices and for U.S. housing in particular lower mortgage rates are likely to unlock disposable income for consumers. On the cautious side, the negative yield backdrop is likely to have consequences in the future as expected asset returns decline and asset ‘duration’ or interest rate sensitivity increases.
Christos Charalambous CFA
Senior Strategist
christos.charalambous@edgewealth.com
Please remember that past performance may not be indicative of future results. Different types of investments involve varying degrees of risk, and there can be no assurance that the future performance of any specific investment, investment strategy, or product made reference to directly or indirectly in this newsletter (article), will be profitable, equal any corresponding indicated historical performance level(s, or be suitable for your portfolio. Due to various factors, including changing market conditions, the content may no longer be reflective of current opinions or positions. Moreover, you should not assume that any discussion or information contained in this newsletter (article) serves as the receipt of, or as a substitute for, personalized investment advice from Edge Wealth Management, LLC. To the extent that a reader has any questions regarding the applicability of any specific issue discussed above to his/her individual situation, he/she is encouraged to consult with the professional advisor of his/her choosing. A copy of our current written disclosure statement discussing our advisory services and fees is available for review upon request.