Low Volatility Regime Likely to Be Tested
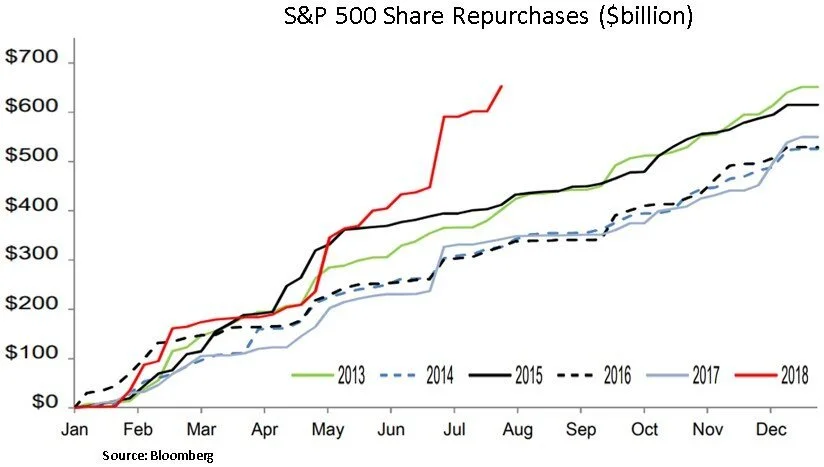
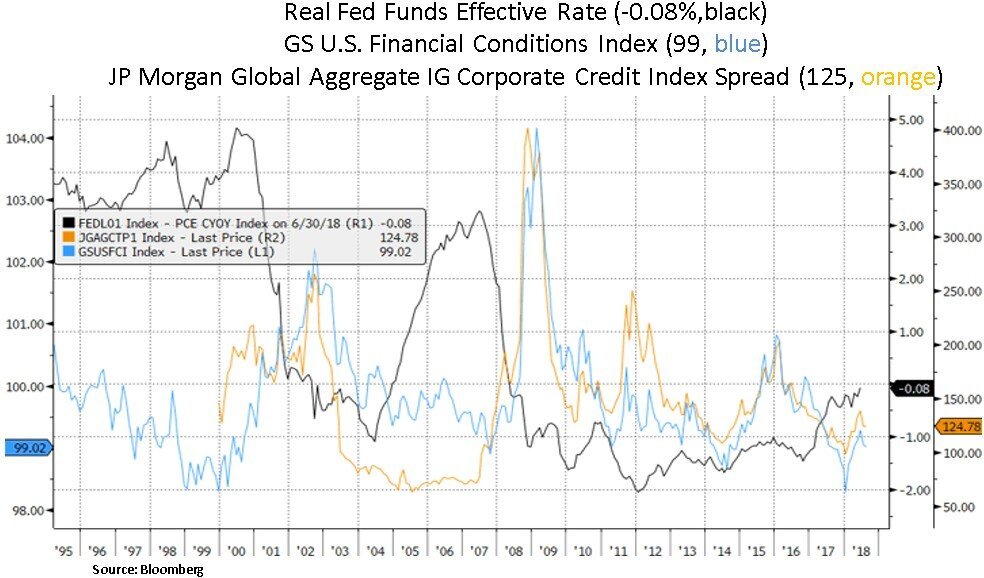
Financial markets are navigating a backdrop that is featuring cyclical U.S. economic momentum (4.1% Q2 GDP growth) and robust U.S. corporate profitability and liquidity conditions. A strong Q2 earnings season and accelerating share repurchase activity have suppressed U.S. equity volatility. August is the most popular month for repurchase executions, accounting for 13% of annual activity. Corporate credit spreads and overall financial conditions remain accommodative despite the ongoing monetary tightening by the Federal Reserve. Moreover, adjusted by the Fed’s favorite inflation indicator (core PCE) the real effective Fed Funds rate is still in negative territory. At the time of this writing, the S&P 500 is just 0.5% off its all-time high (hit on Jan 26th, 2018) and equity volatility is subdued (VIX at 11). Apart from healthy private investment spending, the most notable highlight of the Q2 GDP report was the BEA’s personal income revision which lifted the household savings rate to 6.8% from 3.2%. Household health matters for the Fed’s plans to continue to raise the Fed Funds rate (median target of 3.4% by 2020) and downsize its balance sheet. From a style perspective, we note that in recent months defensive sectors and value equities have been outperforming growth/momentum equities.
As we look in the months ahead, there is scope for volatility to pick up as we approach the U.S. mid-term elections (Congressional control concerns) and as trade frictions may continue to weigh on global export orders; which have been weakening as of late, along with a probable cycle peak for U.S. manufacturing and inflation expectations. Unless there is a trade policy detente right before the elections, weakness in the Chinese Yuan may also continue to be a disinflationary concern; despite recent monetary easing moves by the PBOC (People’s Bank of China).
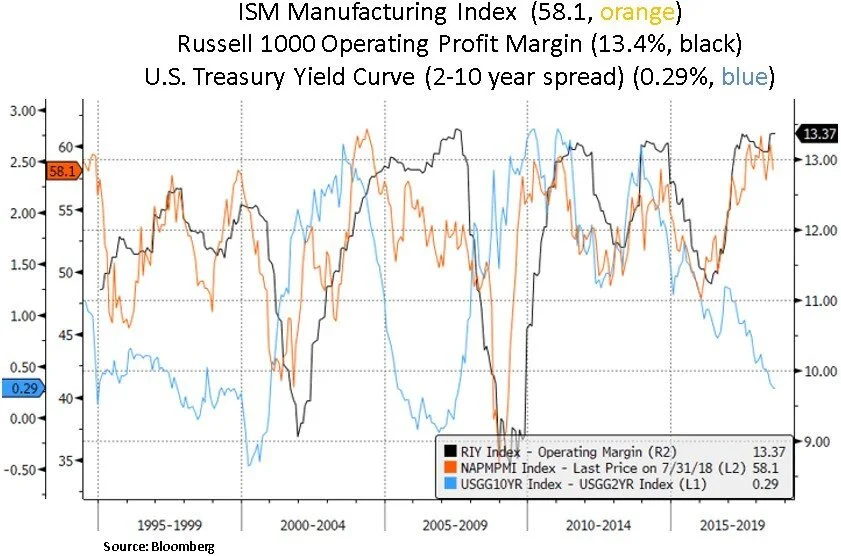
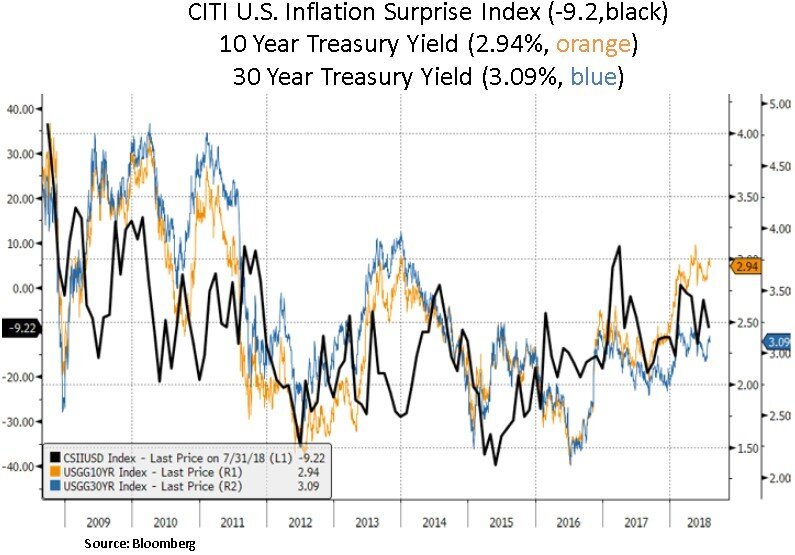
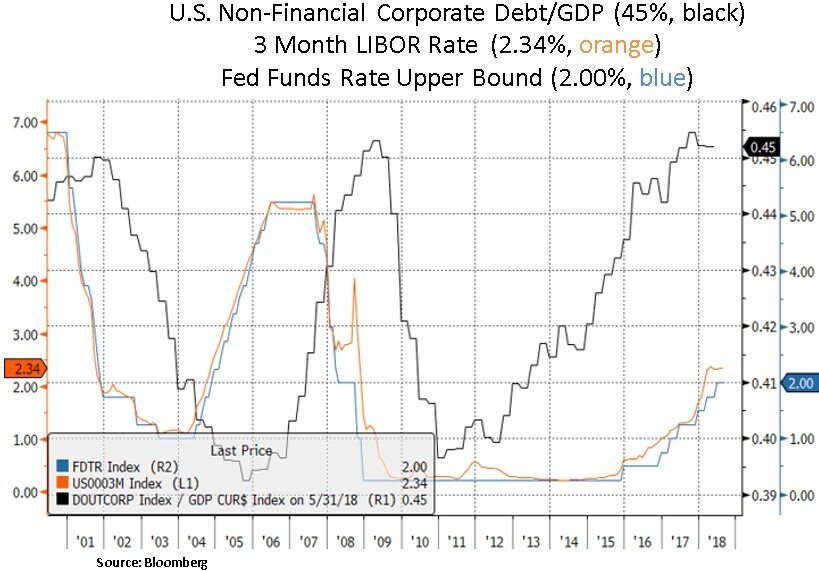
Historically, there has been a close relationship between U.S. manufacturing surveys and equity returns, largely as operating margins track cyclical U.S. and global manufacturing activity. Recent readings may indicate a cycle peak for U.S. manufacturing and inflation pressures. The CITI U.S. inflation surprise index has also pointed to some easing in inflation pressures. A flattening yield curve and elevated non-financial U.S. corporate leverage may also point to tighter financial conditions and moderating profitability growth rates as we head into 2019. Monetary policy works with a lag and we also note that global earnings per share (EPS) revisions appear to have also peaked. The question is at what stage will the Fed pause tightening. Currently, real policy rates are outright negative and financial conditions are still historically accommodative. In the last eight cycles, the U.S. never entered a slowdown with negative policy rates. Real rates were at least at 1.8%, or higher, in the six-month run-up to the downturn. Therefore, the Fed still has runway to tighten.
From our investment perspective, we continue to be mindful of security valuations (e.g. within the industrials sector) and we look to be more aggressive capital allocators during volatility episodes. We continue to favor sustainable income generating instruments as we see secular demand for income e.g. as demographic tailwinds are accelerating with Baby Boomer retirements. Moderating inflation pressures will likely be a positive catalyst for interest sensitive securities. Thematically, we continue to like secular growth opportunities in the technology and healthcare sectors. We favor themes such as automation, artificial intelligence and innovative therapies such as immune oncology. In the energy sector, we continue to favor structural demand for mid-stream and pipeline infrastructure via master limited partnerships (MLPs). Recent bottlenecks in key shale basins such as the Permian highlight the strong demand for oil/gas takeaway capacity. The lifting of the oil export ban and the build-out for liquefied natural gas (LNG) have been tailwinds for MLP fundamentals. We also note that recent corporate simplification (e.g. ETE/ETP merger) is a positive for the sector’s credit profile and thus dividend sustainability.

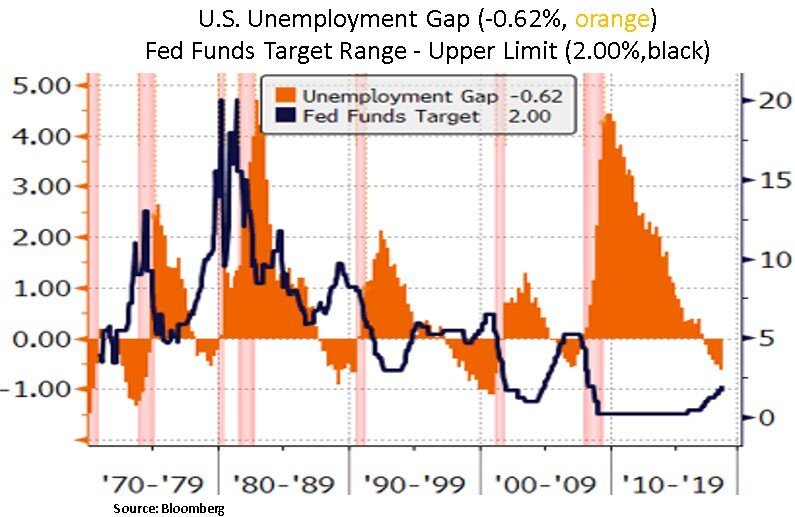
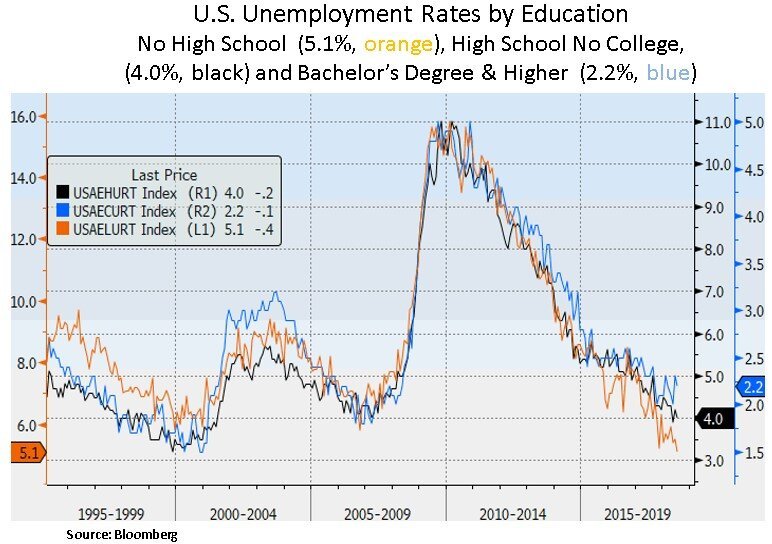
Lastly, we highlight below that with 6.6 million job openings the U.S. labor market continues to face a skills gap. As such, the unemployment gap (actual unemployment less the natural rate of unemployment) has continued to widen which is pointing to a tight labor force. The most recent wage inflation reading however has been flat (at 2.7%) as labor market growth has been driven by ‘cheaper’ lower education labor. As we can see below, labor shortages and Fed tightening have often preceded prior recessions. Thus, we are mindful of the current labor cycle peaking in the coming quarters; which would in turn mark a final cycle high for wage inflation.
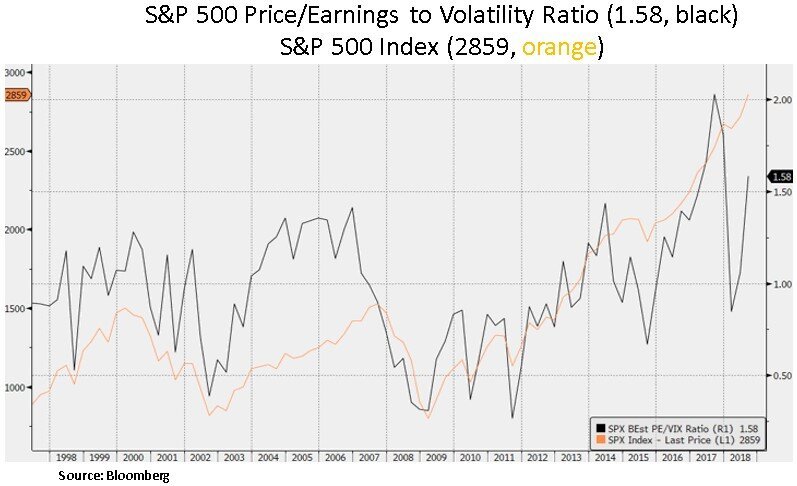
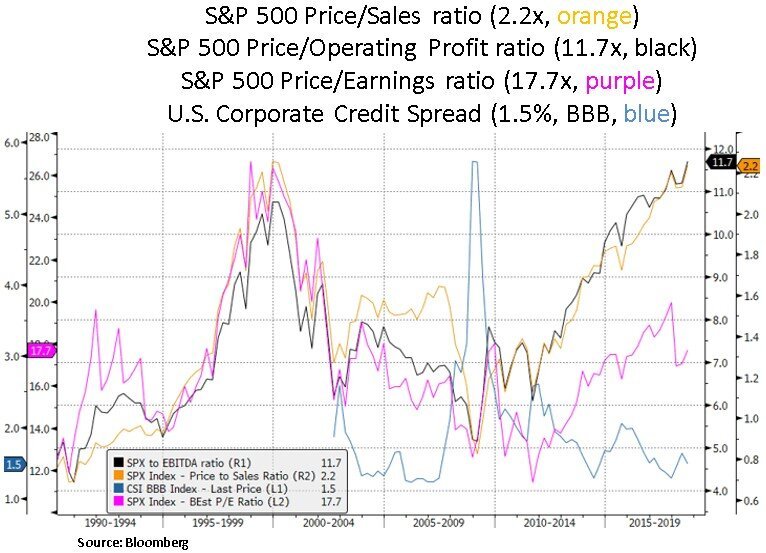
In conclusion, we are currently experiencing a low volatility window because of strong corporate fundamentals and ample liquidity as indicated via record share repurchases and undemanding credit spreads. The question in coming quarters is whether trade frictions may weigh on the global growth outlook while the Fed continues with policy normalization; which in turn drains global USD liquidity. Thus, with historically elevated valuation levels and subdued volatility readings, we expect the low volatility regime to be tested in the coming months; which would enable us to be more aggressive capital allocators.
Christos Charalambous CFA
Senior Strategist
christos.charalambous@edgewealth.com
Please remember that past performance may not be indicative of future results. Different types of investments involve varying degrees of risk, and there can be no assurance that the future performance of any specific investment, investment strategy, or product made reference to directly or indirectly in this newsletter (article), will be profitable, equal any corresponding indicated historical performance level(s), or be suitable for your portfolio. Due to various factors, including changing market conditions, the content may no longer be reflective of current opinions or positions. Moreover, you should not assume that any discussion or information contained in this newsletter (article) serves as the receipt of, or as a substitute for, personalized investment advice from Edge Wealth Management, LLC. To the extent that a reader has any questions regarding the applicability of any specific issue discussed above to his/her individual situation, he/she is encouraged to consult with the professional advisor of his/her choosing. A copy of our current written disclosure statement discussing our advisory services and fees is available for review upon request.