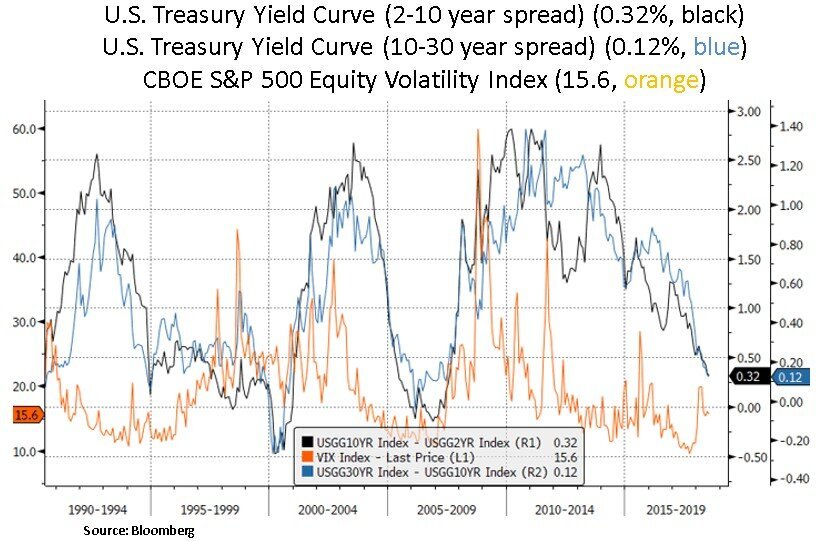
U.S. Yield Curve Flattening Further
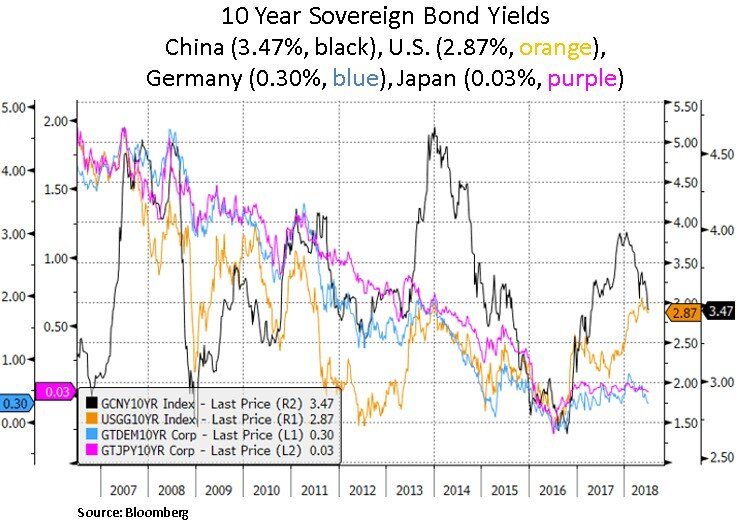
Financial markets are navigating a backdrop that is featuring regional growth and policy divergences. The U.S. economy continues to outperform the Eurozone’s economic activity and the pace of respective monetary policy normalization reflects this growth divergence. At the asset level, investors have also witnessed a decorrelation between regional asset classes. Year-to-date, U.S. equities have outperformed European and Emerging Market equity benchmarks i.e. S&P 500 +2.96%, MSCI Europe -0.07% and MSCI Emerging Markets -8.34%. On the Treasury front, the yield curve flattening is continuing as the Fed has stayed on course with policy tightening, despite some global disinflationary risks arising i.e. U.S. trade tariff concerns and emerging market credit/FX vulnerabilities. On July 6th a 25% tariff on $34bn worth of Chinese imports will be imposed. China has promised to retaliate with tariffs of its own and we note the recent weakness in Chinese export orders and the Chinese currency. Moreover, there has been a recent drop in German and Japanese auto export expectations that may reflect the threat of U.S. tariffs. Lastly, on the EM currency front, the recent rise in the US dollar has placed pressure on EM Central Banks to tighten.
Yet, despite these concerns, U.S. equities have decoupled to some degree from the global tightening of financial conditions. Due to the U.S. tax reform and corporate cash repatriation, the U.S. benefits from record high share buybacks and relatively better earnings momentum. As discussed in prior notes, we view 2019-2020 as a trickier investing timeframe for an eventual business and asset cycle turn i.e. as U.S. fiscal and global monetary accommodation run their course and financial conditions tightening causes a credit and profit cycle downturn. Historically, U.S. equities have never peaked before the yield curve inverted - with a significant lead-lag.
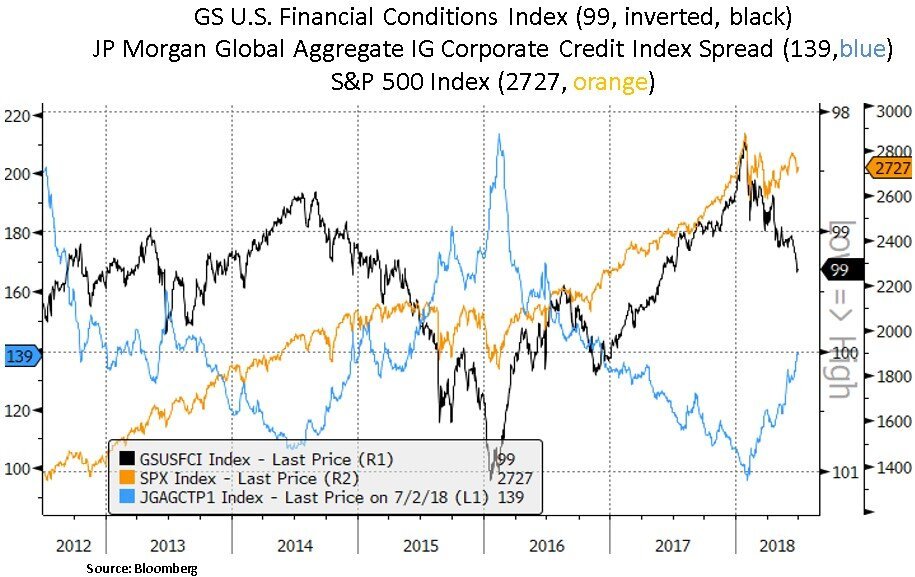


In previous years, the recipe of lower interest rates, Central Bank balance sheet surges and a steep yield curve created incentives for banks to lend; and thus, supported global liquidity conditions. Easy financing conditions pushed asset valuations higher. However, developed market monetary statistics are beginning to paint a different picture - broad money supply growth appears to be decelerating. Global economic activity is cooling; in contrast to last year’s synchronized growth setting. Therefore, as we gauge 2019, global inflation expectations will likely peak cyclically by year-end. As the Fed has signaled another 4 rate hikes by June 2019, these rate expectations may be at risk - particularly if the yield curve comes closer to inversion; which historically has been a recession harbinger in most cases. We highlight the recent positive price action in long-term Treasurys and quasi-fixed income securities such as utilities, telecoms and preferred shares. We view income generation as a key component of our portfolio construction; particularly as a retiring Boomer generation will likely sustain secular demand for income generating instruments.
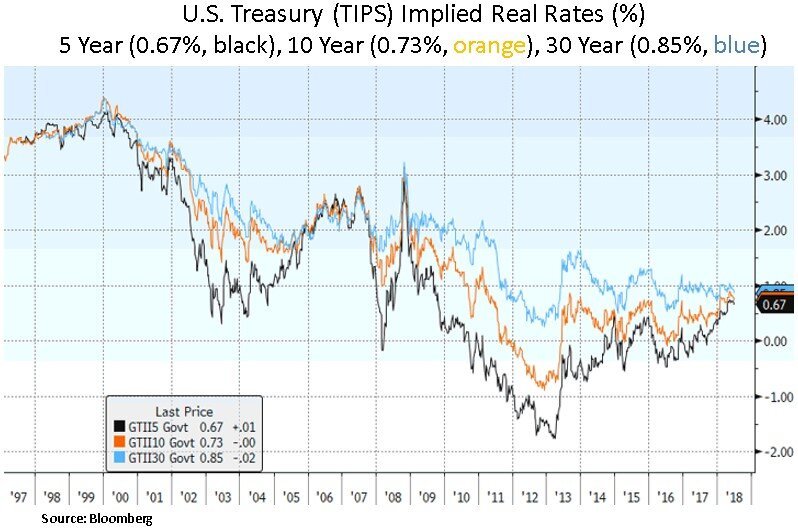
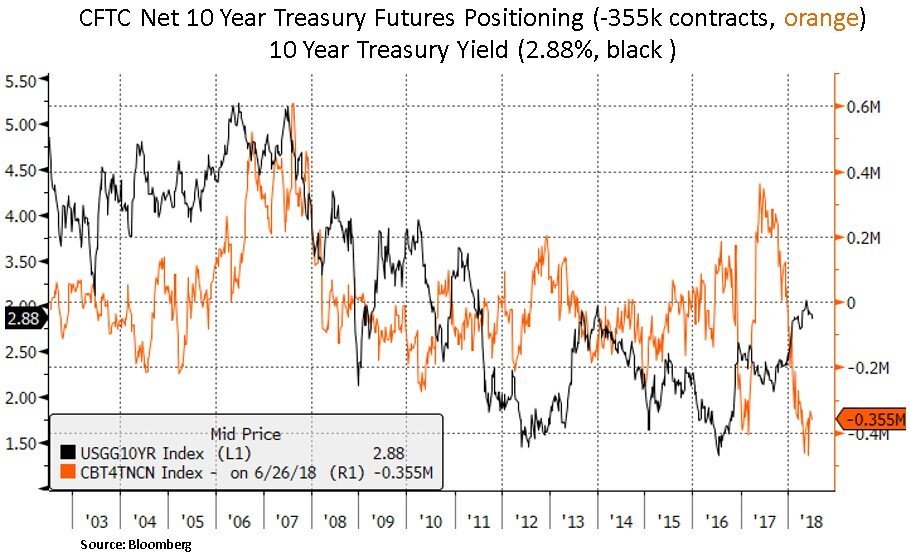
With a historically low U.S. unemployment rate at 3.8% and a fiscally induced U.S. economic momentum, inflation expectations will likely hit an ‘as good as it gets’ moment as we enter 2019. We also highlight below the still bearish speculative positioning in 10 Year Treasurys. A less rosy global growth picture in the second half of 2018, could trigger a short squeeze in the back-end of the Treasury curve. Thus, real rates and global sovereign bond yields may well stay in check. Global Central Banks could also elongate their liquidity withdrawal plan. We are already seeing some easing measures by the Chinese monetary authorities. In addition, the ECB delivered a dovish surprise recently despite announcing the likely end of its asset purchase program; by strengthening its forward guidance to not expect a raise in its policy rate before end-summer 2019, which in turn pushed down the euro. From our investment perspective, we look to be more aggressive allocators of capital during interest rate and equity volatility episodes.

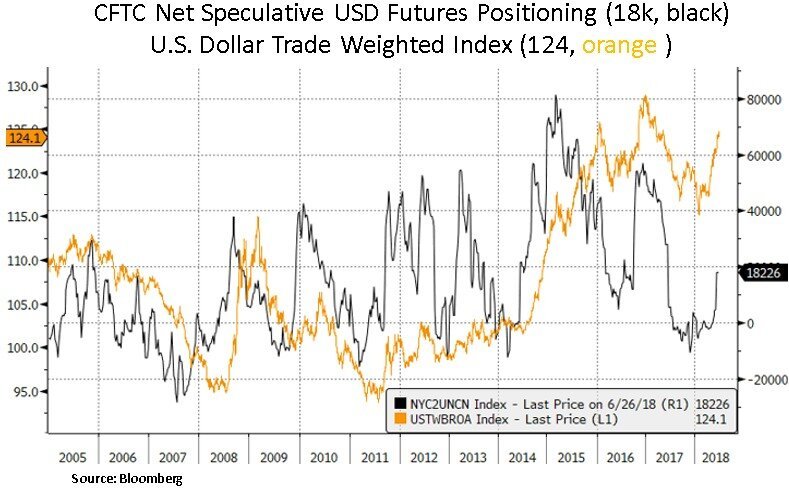
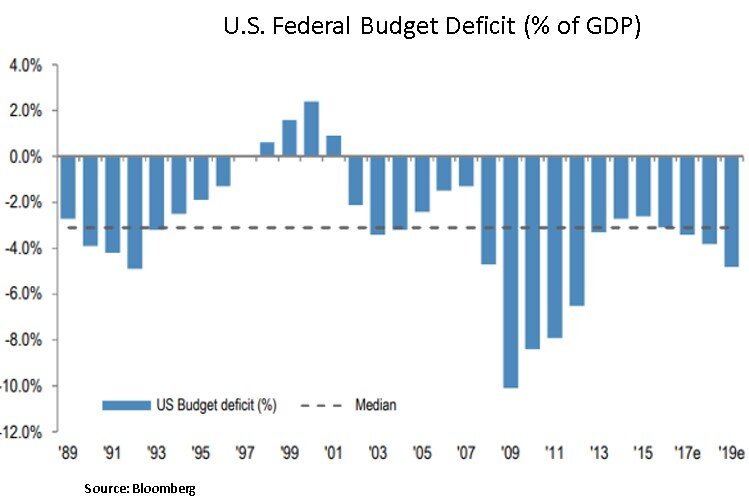
Lastly, we note below that rising U.S. fiscal deficits will likely require higher capital inflows, meaning the U.S. will need to offer compensation via higher yields or a cheaper exchange rate. Given high U.S. leverage, particularly in the corporate sector, higher yields will be more difficult to manage, suggesting a long-term weaker USD outlook is plausible. The Fed may also want to restrain or even reverse its policy course to facilitate the funding of these expanding deficits. One also needs to consider that these deficits do not assume a recession i.e. these deficits could be even wider in % terms in a GDP deceleration scenario. Thus, an eventual Fed policy reversal could weigh on the USD. Most likely, a yield curve inversion and a drop-off in inflation expectations will prod the Fed into policy reversal.
In conclusion, the flattening U.S. yield curve is signaling some uncertainty on the path of long-term interest rates and inflation expectations. Tighter than warranted global financial conditions may induce a yield curve inversion in the coming quarters. We look to take advantage of any disinflationary episodes that will likely challenge the currently pro-inflation consensus positioning. From a bottom-up perspective, we continue to seek stock specific opportunities with ample valuation cushion and capital return capacity.
Christos Charalambous CFA
Senior Strategist
christos.charalambous@edgewealth.com
Please remember that past performance may not be indicative of future results. Different types of investments involve varying degrees of risk, and there can be no assurance that the future performance of any specific investment, investment strategy, or product made reference to directly or indirectly in this newsletter (article), will be profitable, equal any corresponding indicated historical performance level(s), or be suitable for your portfolio. Due to various factors, including changing market conditions, the content may no longer be reflective of current opinions or positions. Moreover, you should not assume that any discussion or information contained in this newsletter (article) serves as the receipt of, or as a substitute for, personalized investment advice from Edge Wealth Management, LLC. To the extent that a reader has any questions regarding the applicability of any specific issue discussed above to his/her individual situation, he/she is encouraged to consult with the professional advisor of his/her choosing. A copy of our current written disclosure statement discussing our advisory services and fees is available for review upon request.