Ultra-loose monetary policies turning a corner
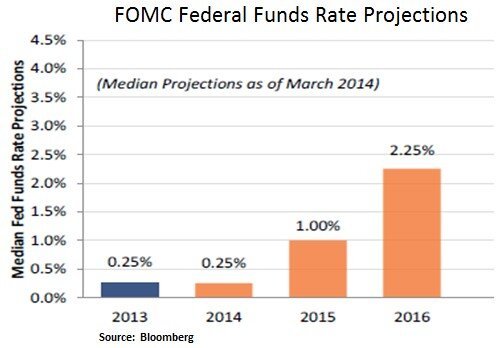
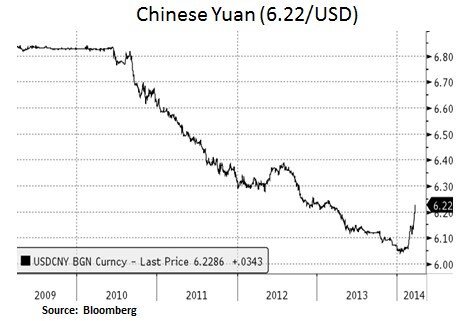
Financial markets are currently witnessing an upward bias on the global cost of capital. In the U.S, with Janet Yellen now at the helm, the Fed has continued its quantitative easing exit strategy. At its recent FOMC meeting, the Fed cut the pace of its bond-buying program by $10bn a month to $55bn and also revised its median forecast for the Fed funds rate, from 0.75% to 1% by the end of 2015. In China, the PBOC is attempting to rein in on excess credit creation. For example, the PBOC has widened the trading band on the Chinese Yuan from +/- 1% to +/- 2% around a key reference date as it wishes to discourage speculative carry trading. On the global equity front, we are seeing divergence in market performance year-to-date e.g. S&P 500 +1.3%, DOW -1.5%, MSCI Europe - 0.6%, German DAX -2.7%, NIKKEI -12.7%, Shanghai Comp -5.8%. In our view, GDP growth expectations are still firm in developed markets (U.S., Europe) but in China and Japan financial markets are indicating downside risks. From our perspective, we continue to favor a balanced portfolio of fixed income instruments (non-agency MBS) and selective large-cap U.S. equities. Moreover, as the fixed income market recalibrates the timing of interest rate hikes in the U.S., we seek to take advantage of any meaningful back-up in yields and allocate capital in quasi-fixed income instruments such as preferred equities, REITS, MLPs and interest rate sensitive sectors such as utilities.
As we can see below, after the recent hawkish undertones at the Fed’s FOMC meeting, the Treasury market has priced earlier than expected interest rate increases. At the front end of the Treasury curve for example, the 2 year note saw a sharp increase in its yield from 35 to 43 basis points. In addition, the U.S. dollar showed broad strength against major currencies and weighed on precious metals. In our view, five years into the economic recovery, a steady job market and a recent pick-up in credit demand support an exit from ultra-loose monetary policy.
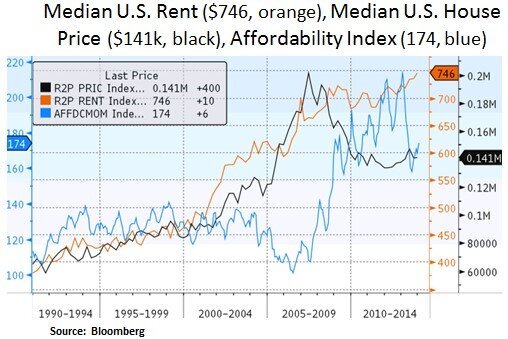
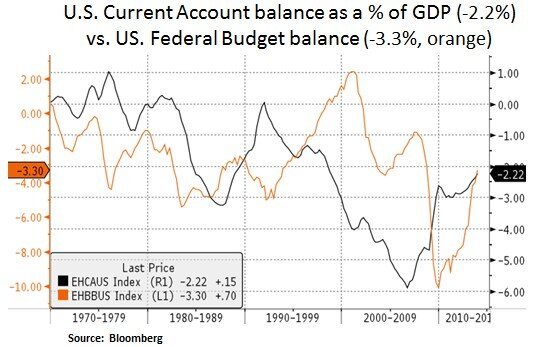
Our view on the U.S. economy remains constructive. Housing activity is still at multi-decade lows and our ‘slow and steady’ scenario is still in place. With low inventories and still affordable housing by historical standards, we see further upside to residential construction. Housing has a high multiplier effect via the labor market, bank balance sheets and consumer confidence. The energy sector is an additional growth area which contributes to the country’s trade, current account and fiscal balances. With geopolitical tensions rising between Europe and Russia we view the U.S. domestic energy sector and related industrials as beneficiaries of increased U.S. energy exports. Lastly, corporate balance sheets have the capacity to contribute to U.S. growth via incremental capital expenditures. We highlight the technology sector as a beneficiary of a likely pick-up in enterprise spending.
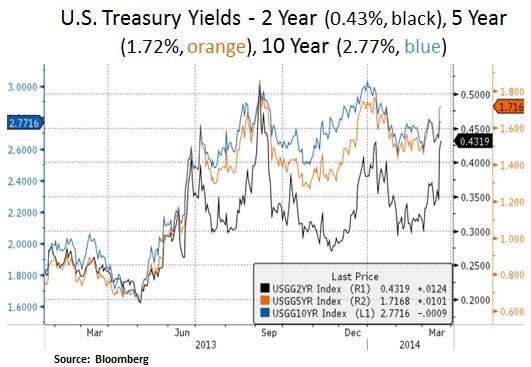


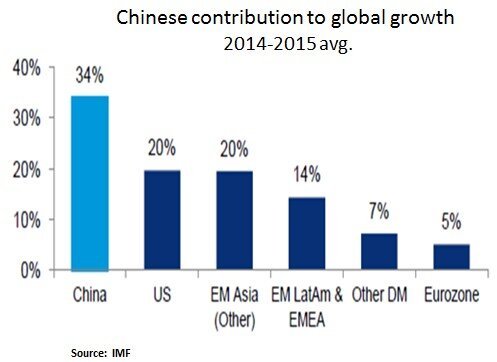
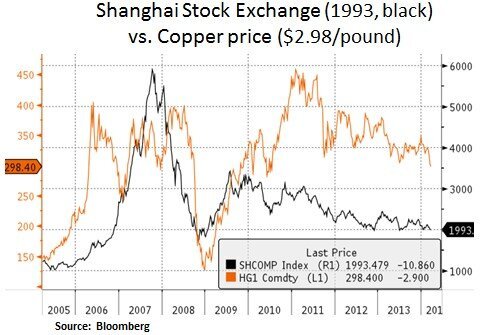
Our constructive view on the U.S. economy is balanced however with a more cautious view on the Asian and Emerging Market growth backdrop. As the G10 economic surprise index shows below, 2014 started with some lackluster growth; partly due to softer weather related U.S. growth but mainly due to growth headwinds in China and Emerging Markets. Seen in a global context, it is no coincidence that U.S. Treasuries such as the 10 Year bond have not seen higher yields (now at 2.77%); even after three rounds of Fed tapering of its asset purchasing program and marginally higher interest rate expectations. Consensus global GDP growth expectations point to 3.4% growth in 2014 and 3.7% in 2015. China is still expected to contribute ~1/3 of global GDP growth with a 7.3 % average growth rate in 2014 and 2015. In our view, there are downside risks to China’s growth rate as the country attempts to rebalance its economy from an investment and export led model, to a consumption led growth model. Lower demand for base metals such as copper and iron ore is likely to have negative transmission effects in commodity exposed economies e.g. Peru, South Africa and Australia. Moreover, China is attempting to rein in excess credit creation that emanated from its traditional banking system (~14% credit growth Y-Y) and the so called ‘shadow banking’ system that is now accounting for nearly 50% of broad credit creation. Lastly, the PBOC intends to gradually transition the state controlled banking system to a market oriented system. For example, the goal is for full interest rate liberalization by 2016 and admittance of private firms into the financial sector.

In conclusion, we see an attempt by Central Banks such as the Fed and PBOC to rein in on ultra-loose monetary policies. As Emerging Markets face elevated risks for capital outflows, there is downward pressure on their currencies especially if they face external or short-term financing needs. As the Fed normalizes its monetary policy, a stronger USD puts upward pressure on EM external borrowing costs. Thus, our current big picture view calls for an upward bias to the global cost of capital. As it pertains to the U.S. Treasury market however, we don’t expect an aggressive interest rate hike cycle by the Fed in the 2015-2016 time frame. A Chinese/EM growth slowdown is likely to keep global growth and inflation expectations in check. Thus, from a portfolio perspective, we still favor a balanced portfolio of high cash flow generating fixed income and selective equity instruments. Within equities we continue to avoid exposure to the materials sector and within industrials we have a preference for late-cycle and long product cycle exposures. At the sector level, we also favor more secular growth stories e.g. healthcare, technology. From a market-cap valuation perspective, we view small-cap equities as expensive. We thus prefer selective exposure in large-cap U.S. equities that have better balance sheet profiles and supportive capital allocation policies. Lastly, if we see upward pressure in yields, we would be better buyers of quasi-fixed income instruments that offer high dividend yields e.g. preferred equities, REITS, MLPs and utilities.
Christos Charalambous CFA
Senior Strategist
christos.charalambous@edgewealth.com
Please remember that past performance may not be indicative of future results. Different types of investments involve varying degrees of risk, and there can be no assurance that the future performance of any specific investment, investment strategy, or product made reference to directly or indirectly in this newsletter (article), will be profitable, equal any corresponding indicated historical performance level(s, or be suitable for your portfolio. Due to various factors, including changing market conditions, the content may no longer be reflective of current opinions or positions. Moreover, you should not assume that any discussion or information contained in this newsletter (article) serves as the receipt of, or as a substitute for, personalized investment advice from Edge Wealth Management, LLC. To the extent that a reader has any questions regarding the applicability of any specific issue discussed above to his/her individual situation, he/she is encouraged to consult with the professional advisor of his/her choosing. A copy of our current written disclosure statement discussing our advisory services and fees is available for review upon request.