Central Bank Inflation Mandates Nearing Fulfillment
Happy New Year. Financial market participants enter 2018 with a pro-inflationary mindset and a risk seeking appetite. The global economy expanded at a 3.3% annualized pace over the past six quarters, its best sustained performance since the rebound from the deep recession during 2009-10. A combination of time, balance sheet healing and extraordinary monetary policy accommodation has promoted a more traditional business cycle dynamic, where a positive feedback loop linking growth to supportive financial conditions and rising sentiment delivers a synchronized global upturn. This loop can be sustained for some time but eventually is challenged by credit driven pressures related to a cyclical upturn in consumer and producer price inflation; particularly as global labor markets are approaching full employment levels and energy prices have been firming higher. Thus, as Central Bank inflation mandates are likely on track, market focus is likely to shift in 2018 to global monetary tightening and its consequent impact on global sovereign yields and corporate credit spreads. The start of 2018 marks the beginning of the European Central Bank's efforts to reduce liquidity injections by halving monthly bond purchases to 30 billion euros. The Fed’s guidance for 2018 is that it expects to undertake three more interest rate hikes and to accelerate its balance sheet contraction to an eventual pace of $600 billion by Q4 of 2018.
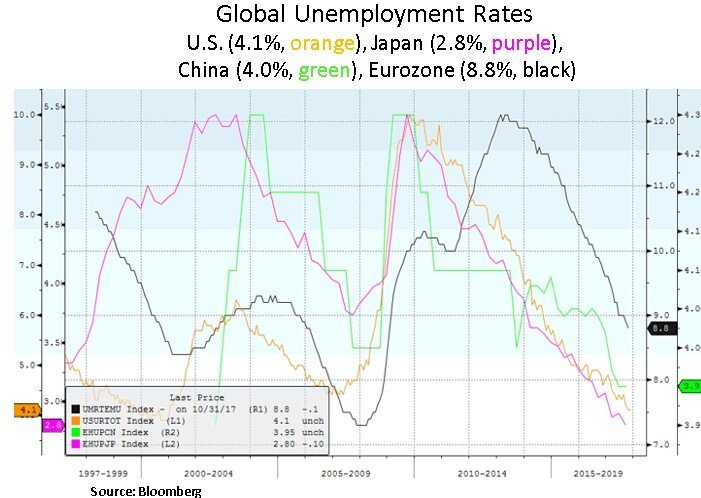
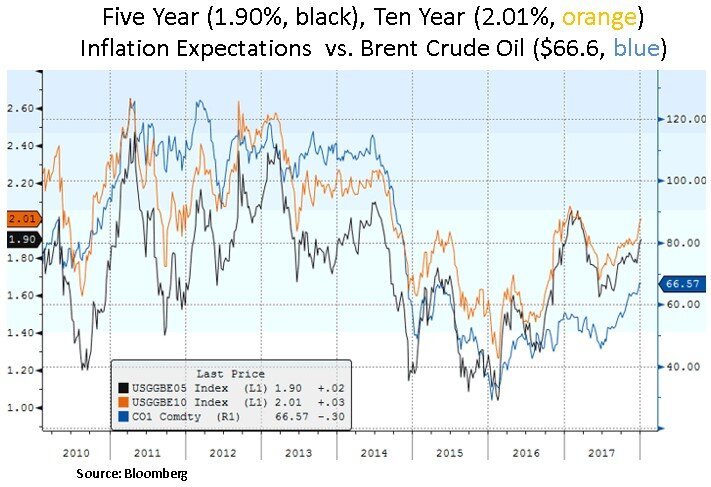
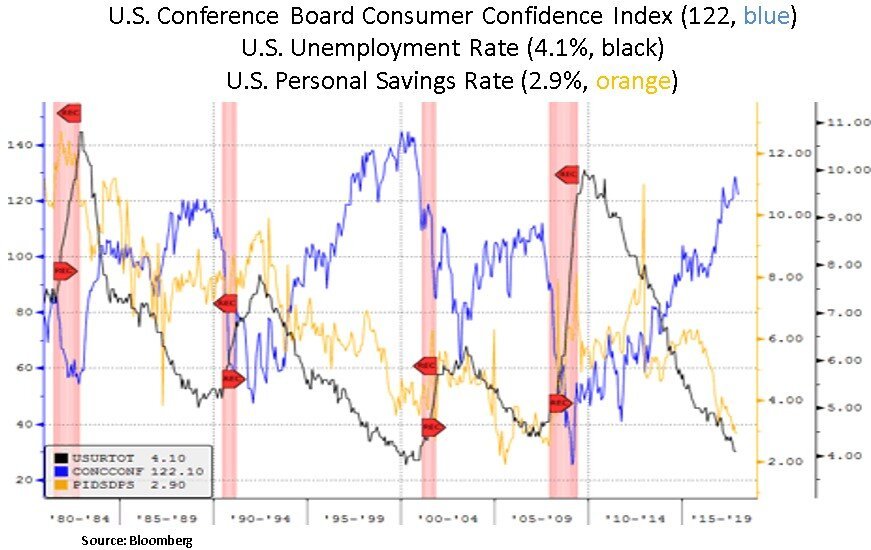
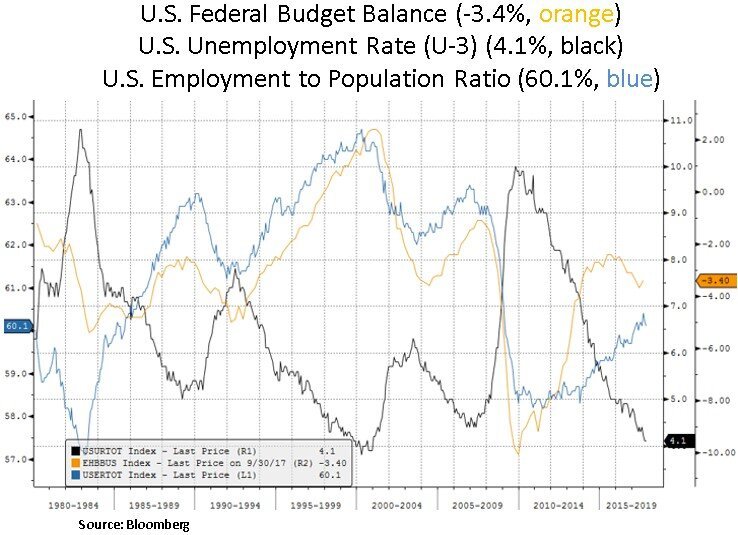
As we can see below, the global labor market cycles are at an advanced stage and inflation expectations have been firming higher along with the recent recovery in energy prices. U.S. consumer confidence is near historical highs and a declining personal savings rate indicates that U.S. consumer pent-up demand may have largely run its cyclical course i.e. a high initial saving rate has historically been associated with subsequently stronger economic growth, while a low saving rate produces a lower future growth pattern. Thus, long-run U.S. real rates may stay range bound.

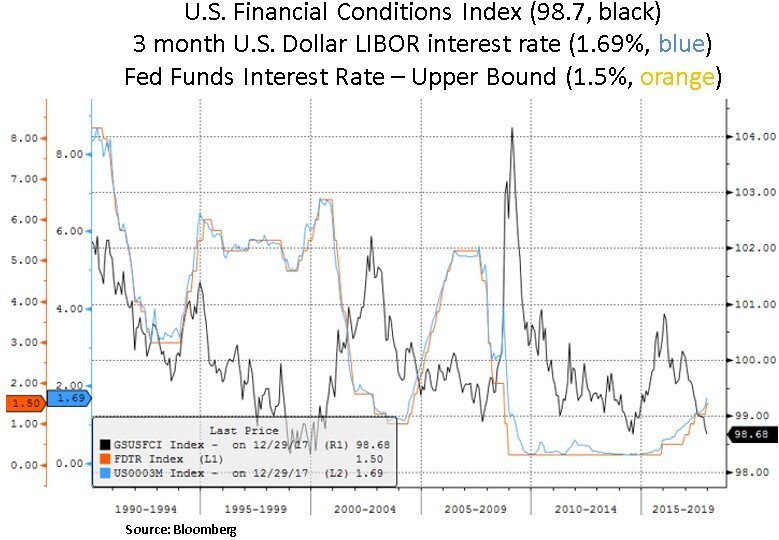
U.S. tax cuts will likely add modestly (~0.3%) to U.S. GDP growth in 2018. A lower tax bill may ease some of the cyclically elevated corporate level of debt carried in the U.S. economy but as the Fed tightens, sensitivity of U.S. growth and inflation expectations to rises in interest rates will likely stay elevated. As such, if the Fed remains committed to three rate hikes, the risk of Treasury yield curve inversion is very real - as we can see below the 2-10-year yield spread is only 0.54%. Over the long-run, because of the elevated level of U.S. government debt and deteriorating fiscal situation, the economy is unlikely to benefit sustainably from further debt-financed tax changes. Thus, more restrained long-run inflation expectations may keep long-term Treasury yields range bound. In the short-term however, with benign U.S. financial conditions indicators and asset prices at historic highs, the Fed has more runway to proceed with its policy normalization. Historically, a flattening or an inverted yield curve has been a precursor to a credit cycle downturn and a pick-up in asset price volatility; particularly as credit spreads widen. With corporate credit spreads at historical lows one should expect a mean reversion in asset volatility; which would likely open better opportunities to deploy capital more aggressively in both equity and fixed income markets.
Apart from the shape of the U.S. Treasury yield curve, we highlight below the notable divergence between the U.S. Treasury yields and key European sovereign bond yields; particularly at the front-end of their respective yield curves whereby certain bond yields are still in negative territory. As the Eurozone has now transitioned to economic expansion and the ECB is paring back its asset purchasing program, there is upward yield and currency headwind risks. On the other side of the FX cross rate, a weaker USD benefits U.S. sectors such as tech, healthcare and energy.


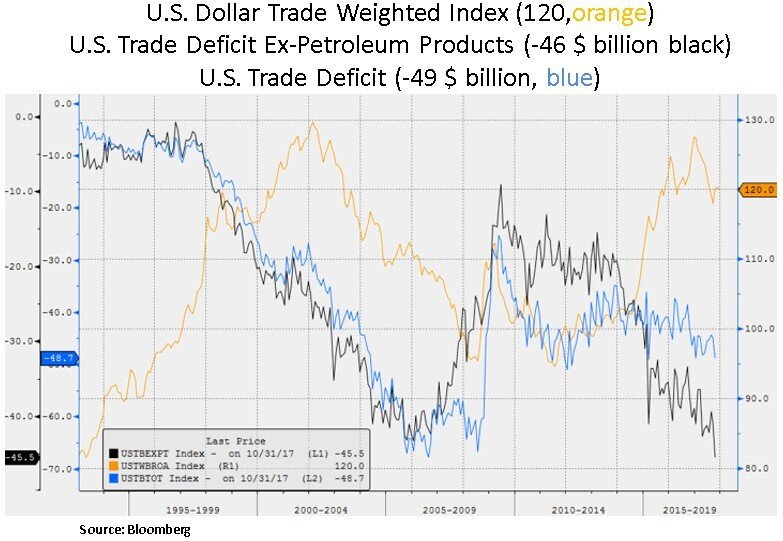
Lastly, we highlight below the current state of the U.S. trade and fiscal deficits vs. the trade weighted U.S. dollar index. Despite attractive sovereign bond yield differentials, market focus is shifting on the trajectory of future U.S. deficits; particularly as the recent $1.5 trillion tax reform will likely increase the fiscal deficit to 5% by 2021. It remains to be seen if U.S. tax reform will engineer a sustainable investment cycle; especially as we enter the 9th year of the current business cycle and the GDP output gap gradually closes i.e. the economy reaches its full potential and starts facing capacity constraints such as labor supply. Therefore, there is scope for the USD to weaken if increased budget deficits do not lead to sustainable long-run GDP growth and the Fed is compelled to eventually pause its tightening program.
In conclusion, as the inflation mandates of global Central Banks get fulfilled, we expect global liquidity conditions to become less accommodative in 2018 and beyond. Thus, as we enter 2018, we continue to focus on individual security selection and look to be opportunistic during credit market induced volatility episodes; that may enable us to deploy capital more aggressively at better valuation levels in both the equity and fixed income spectrums.
Christos Charalambous CFA
Senior Strategist
christos.charalambous@edgewealth.com
Please remember that past performance may not be indicative of future results. Different types of investments involve varying degrees of risk, and there can be no assurance that the future performance of any specific investment, investment strategy, or product made reference to directly or indirectly in this newsletter (article), will be profitable, equal any corresponding indicated historical performance level(s), or be suitable for your portfolio. Due to various factors, including changing market conditions, the content may no longer be reflective of current opinions or positions. Moreover, you should not assume that any discussion or information contained in this newsletter (article) serves as the receipt of, or as a substitute for, personalized investment advice from Edge Wealth Management, LLC. To the extent that a reader has any questions regarding the applicability of any specific issue discussed above to his/her individual situation, he/she is encouraged to consult with the professional advisor of his/her choosing. A copy of our current written disclosure statement discussing our advisory services and fees is available for review upon request.