Goldilocks Backdrop Challenged
Financial market participants have witnessed in the past month a disruption in the Goldilocks setting of low rates and suppressed asset price volatility; that has been supporting financial assets such as U.S. equities. After a 6.4% rise for 2018, the S&P 500 index is now up 0.7% for the year. Complacent sentiment and off-sided market positioning have been challenged by a rise in long-term Treasury yields (e.g. 10 Year Treasury rising by 0.3% to 2.76%) and a rather dramatic rise in U.S. equity volatility (VIX); the latter saw one the largest moves in its history i.e. from 9.1 on Jan 3rd to a high of 50.3 this morning. Fundamentally, both inflation expectations and real rates have risen in recent months – with a notable recent pick-up in U.S. wage inflation (+2.9% Y-Y). Moreover, U.S. EPS revisions have turned positive most recently as market expectations are starting to reflect some of the benefits of successful implementation of tax cuts. On the currency front, recent weakness in the USD also triggered concerns for an inflation scare. In the near-term, one should expect rising volatility across asset classes to trigger additional rounds of positioning adjustments e.g. de-risking by systematic/risk parity/momentum driven funds which were engaged in volatility selling or that may have been carrying leveraged positions. From our perspective, as active managers, we are taking advantage of the recent market dislocation to deploy capital opportunistically and selectively in attractively valued securities.
On a more positive note, investors are enjoying a backdrop that still features historically easy financial conditions. Despite the recent Treasury yield curve steepening, corporate credit spreads have remained low. In addition, the latest U.S. GDP data shows that capital expenditure growth, excluding the oil and mining sector, has finally started to pick up; contrary to the reality over the past year where the investment upswing had been primarily driven by recovery in the oil sector. Specifically, U.S. private non-residential fixed investment growth accelerated from 4.6% Y-Y in Q3 2017 to 6.3% Y-Y in Q4 2017, the highest growth rate since Q3 2014.

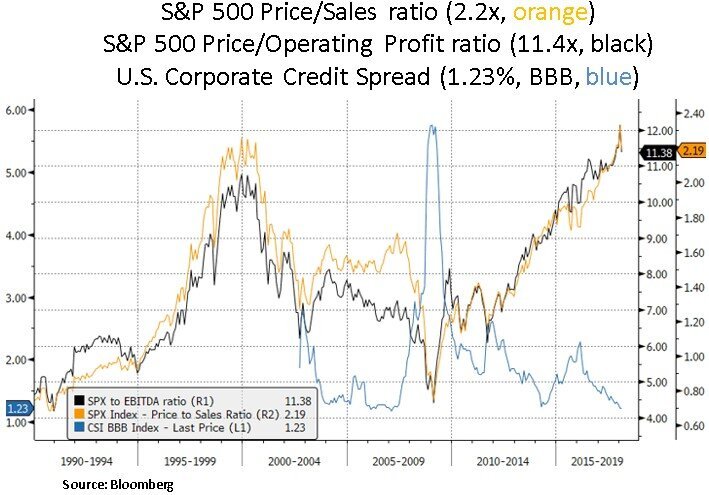


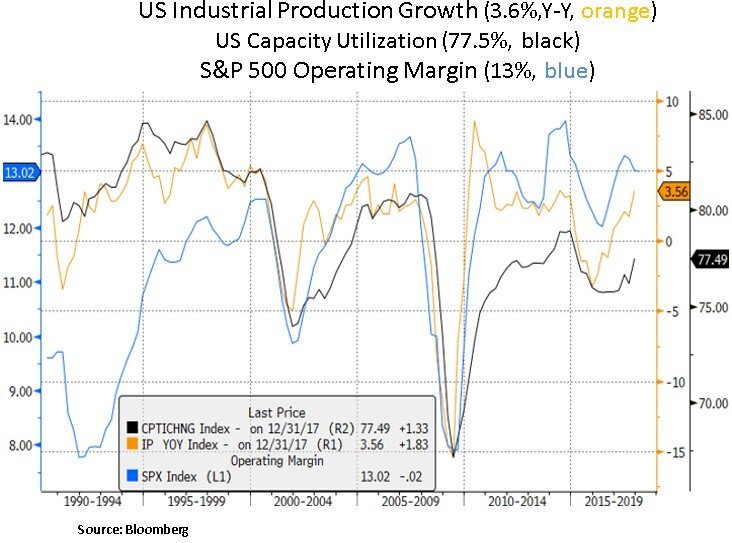
On the inflation front, various surveys are showing increasing labor shortages in the U.S. and abroad. Global unemployment is near the lowest levels in 30 years. U.S. profit margins are elevated in a historical context. The wage share of GDP is still subdued and could be moving higher. Even in Eurozone there has been a sharp increase in labor shortages recently, which could be prelude to a rebound in wages. Labor intensive industries could see a pickup in wages, which could be a threat to margins for those that have limited pricing power. Bigger picture, despite the U.S. business cycle entering its 9th year of expansion, the U.S. economy is still showing traction e.g. the Atlanta Fed is projecting 4% GDP growth in Q1 2018. Moreover, recent U.S. manufacturing readings such as ISM manufacturing is currently near the highest level in 15 years. A strong ISM reading tends to correlate well with corporate profit growth. The question for investors is whether cyclically rising interest rates will create further asset price volatility in 2018 as asset valuations are near historic highs and corporate credit spreads are near historic lows.
Apart from the reflationary backdrop lifting Treasury yields higher, the bond market is also re-assessing the risk premium for Treasuries as U.S. tax cuts will lead to high fiscal deficits; especially at this advanced stage of the economic cycle. Rising deficits are one of the reasons for the recent USD weakness. Increasing deficit funding needs (after the recent $1.5 trillion tax package) will have to be met at a time whereby the Fed will be winding down its balance sheet at a pace of $600bn by Q4 2018. Therefore, we could see some further interest rate volatility across the Treasury yield curve in 2018; that may give us good entry points in interest rate sensitive instruments.


Lastly, we highlight below the G4 Central Bank liquidity picture which is turning less accommodative this year – as Central Banks are normalizing their monetary policies. The impact on assets of the reduction in Central Bank liquidity is an unknown for the rest of the year and beyond. Current market positioning remains bearish across the entire Treasury yield curve; especially at the front-end. Moreover, speculators have been increasing their bearish positioning at the back-end of the curve.


In conclusion, the low interest rate and low volatility Goldilocks backdrop is being challenged in the first months of 2018. As inflation is cyclically picking up and the liquidity picture is turning less accommodative, we remain opportunistic in deploying capital selectively in attractively valued equities and interest sensitive securities. We retain our bias towards large-cap industry leaders that have solid balance sheets, firm capital return potential and visible earnings profiles.
Christos Charalambous CFA
Senior Strategist
christos.charalambous@edgewealth.com
Please remember that past performance may not be indicative of future results. Different types of investments involve varying degrees of risk, and there can be no assurance that the future performance of any specific investment, investment strategy, or product made reference to directly or indirectly in this newsletter (article), will be profitable, equal any corresponding indicated historical performance level(s), or be suitable for your portfolio. Due to various factors, including changing market conditions, the content may no longer be reflective of current opinions or positions. Moreover, you should not assume that any discussion or information contained in this newsletter (article) serves as the receipt of, or as a substitute for, personalized investment advice from Edge Wealth Management, LLC. To the extent that a reader has any questions regarding the applicability of any specific issue discussed above to his/her individual situation, he/she is encouraged to consult with the professional advisor of his/her choosing. A copy of our current written disclosure statement discussing our advisory services and fees is available for review upon request.