Growth and Liquidity Outlook in Focus
Financial markets continue to focus on the outlook for U.S. inflation and its likely repercussions on credit, GDP growth and liquidity. With respect to the U.S. GDP growth outlook there may be some complacency in our view; as monetary tightening is progressing both with respect to policy rates and liquidity conditions. The new Fed Chairman Powell recently suggested that the Fed is biased towards signaling more rather than less rate hikes. The market remains reluctant to price the Fed more fully. For instance, current market pricing is consistent with less than 3 hikes this year and a total of about 4 hikes by the end of next year. The Fed remains on a gradual tightening path, but the Fed’s task is complicated by unfolding fiscal and trade policies. The recent announcement of U.S. steel and aluminum tariffs has taken some of the bloom off the fiscal stimulus rose, as the introduction of tariffs and trade barriers could act as a negative supply shock to the U.S. economy. As a result, U.S. equities have experienced some further near-term volatility. Yet, financial conditions have not tightened materially despite the recent stock market volatility. We note that the most recent reporting season was robust with earnings tracking 8% ahead of consensus estimates and sales over 2% ahead; and U.S. corporations have announced ~$180bn in share repurchases.
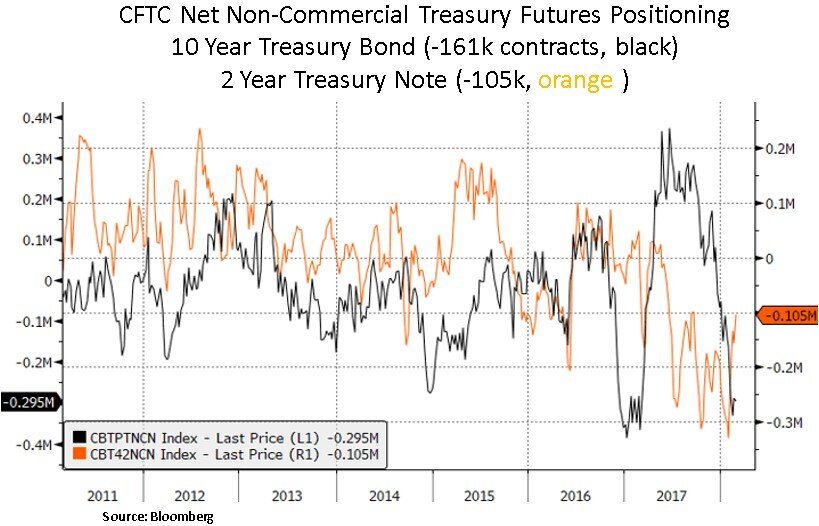
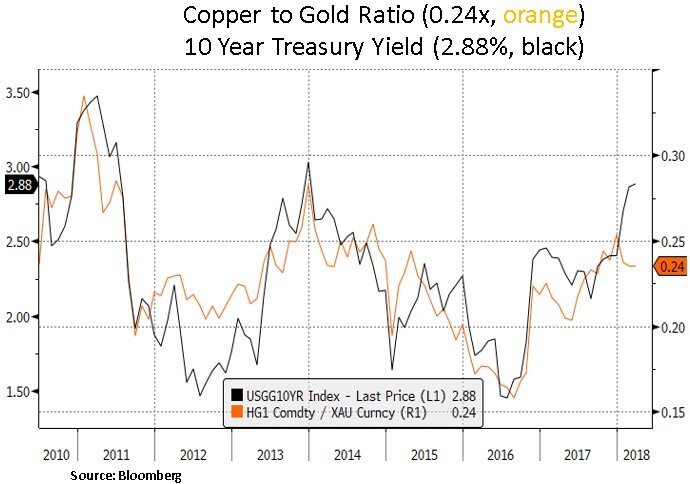
In our view, risk asset volatility, proxied by the VIX index, captures reactions to the prospect of lower excess liquidity. February saw a sharp reversal in market volatility positioning and as such increased equity hedging activity. U.S. Treasury yields are broadly pricing in stronger GDP growth resulting in a higher and more uncertain path for real short rates set by the Fed. Yet, we note that U.S. Treasury net short speculative positioning has eased; with a notable reduction in the front-end of the Treasury curve. In the medium term, positioning remains a short-term constraint to a material repricing higher in rates – particularly if the upcoming U.S. payroll report on Mar 9th indicates less than feared wage pressures. We also note below that the copper to gold ratio may indicate a moderation in expected global inflation. Lastly, TIPS implied inflation expectations look extended vs. energy prices such as crude oil.


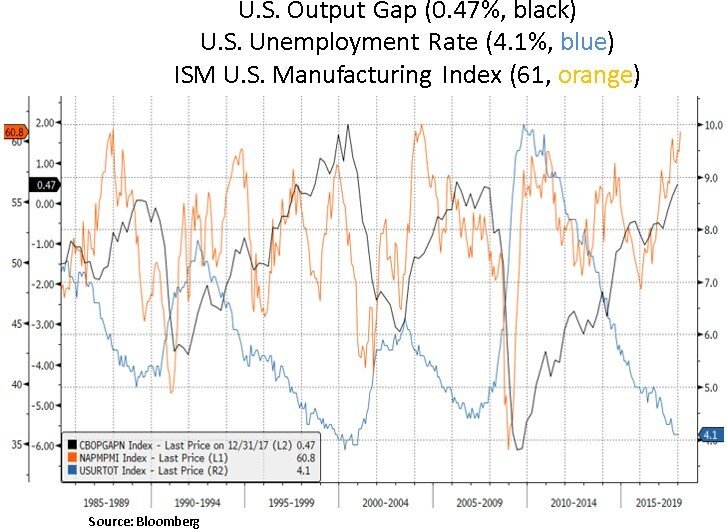
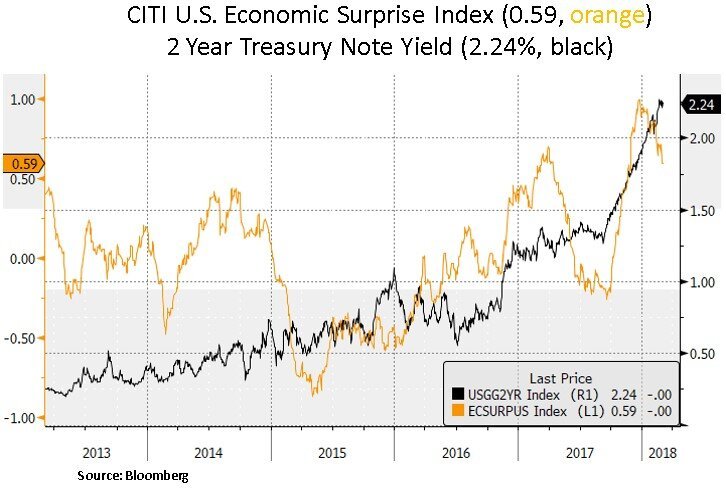
Rising inflation is a normal development in an economy where solid growth is using up spare capacity. As we can see below we are now witnessing a positive GDP output gap; which indicates a U.S. economy that is outperforming expectations because its actual output is higher than the economy's recognized maximum capacity. Apart from being an indicator of potential inflationary or deflationary pressures within an economy, the output gap is also associated with employment levels in an economy. Thus far, U.S. economic momentum has been firm, particularly in U.S. manufacturing but we may be on the verge of peaking. Recent economic surprises have eased. The Fed's own expectations for 4 rate hikes this year may have to be pared back somewhat if inflation and growth are not as robust. From a portfolio perspective, that would be positive catalyst for interest sensitive securities. We have been opportunistic buyers of interest sensitive securities after the wage induced inflation scare earlier in February.
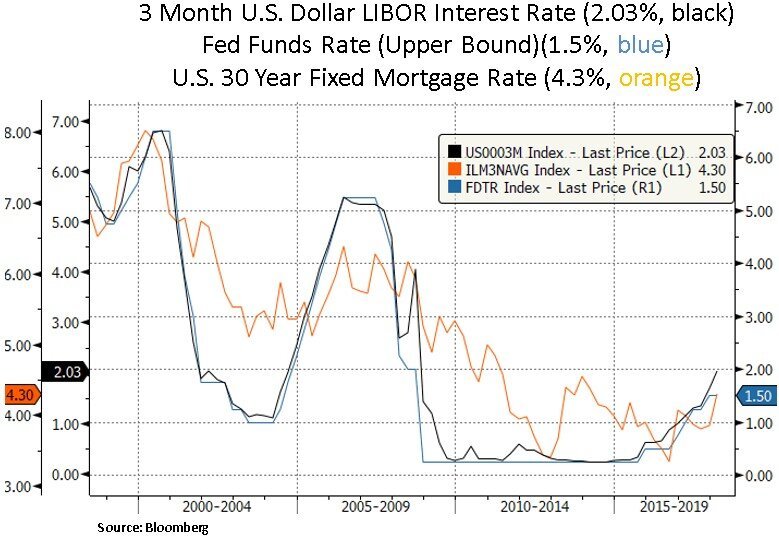
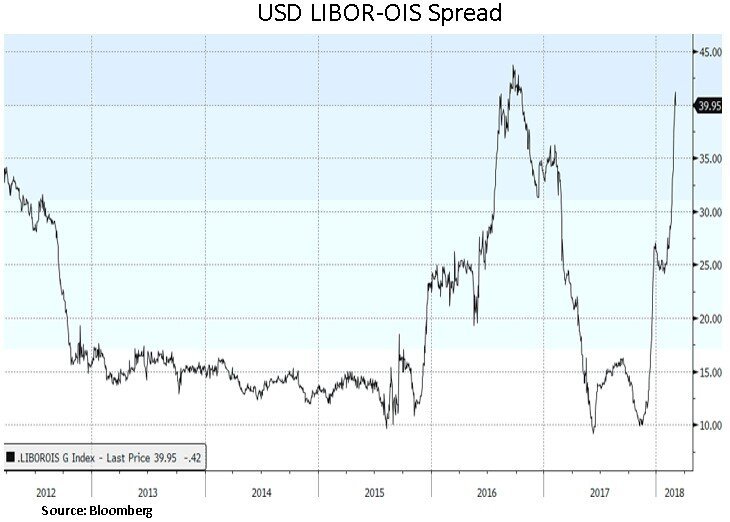
On the credit side, rising bank funding costs in U.S. may pose a headwind for the Fed’s normalization path. We note below that some stress signals in the global credit system are appearing. LIBOR (London Interbank Offered Rate) is the intra-bank interest rate set amongst banks, and the overnight index swap (OIS) rate is determined by Central bank rates. The "LIBOR-OIS spread’ has risen to levels reached during the onset of the Chinese currency crisis in early 2016. The widening in the LIBOR-OIS spread may be signaling some stress within the financial system as a liquidity pressure makes it more expensive for banks to lend to each other. The three-month rate for dollar LIBOR is used to price a vast nexus of financial contracts around the world and has risen to a 10-year high of 2%. A third of U.S. business loans are linked to LIBOR. The recent rise will likely lift interest rates on more than $100 trillion in debt and derivative contracts that are linked to the U.S. benchmark, from business and student loans to home mortgages. One technical reason why LIBOR rose above the Fed’s upper Fed funds target rate is the recent tax overhaul; which is leading companies to reduce investments in short-dated debt as they prepare to return cash stored overseas to the U.S. That decline in investment could continue to create some stresses across short-dated fixed income markets.
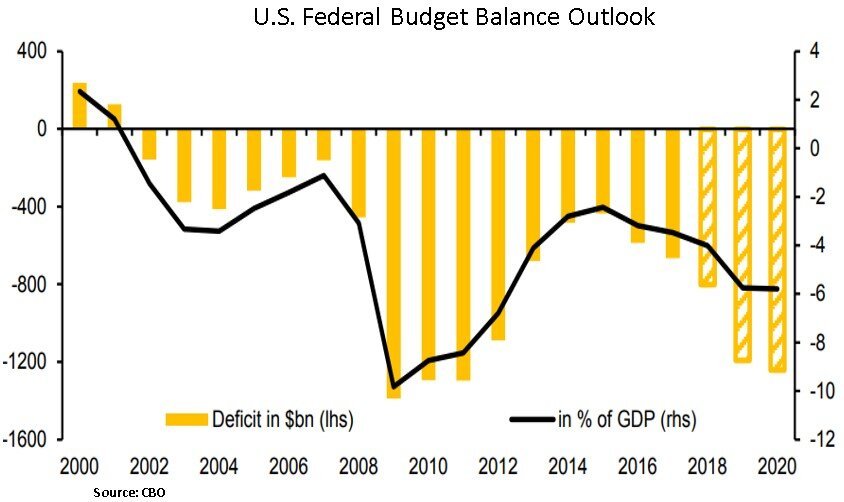
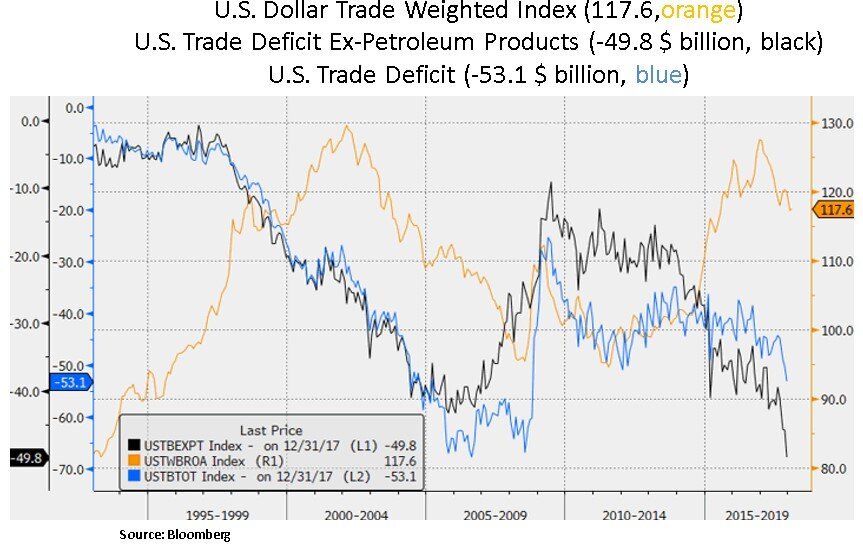
Lastly, we highlight below that the U.S. budget deficit is set to increase materially as a % of GDP, following the adoption of the tax bill last December. As such, government Treasury net bond issuance is likely to increase to a pace of more than $1 trillion per year. The maturing business cycle combined with higher deficits, the cyclical return of inflation and the reduction in Central Bank balance sheets paint a liquidity backdrop that will likely lead to further volatility episodes. Moreover, the U.S. twin deficits (i.e. budget and trade) are likely to be an ongoing headwind for the U.S. Dollar. Despite favorable sovereign bond yield differentials, the market is focusing on the relative quality of sovereign current accounts and fiscal balances. From a portfolio perspective, a weak USD favors U.S. multinationals on the margin e.g. technology and healthcare industry leaders. At this juncture, the Fed is committed to policy normalization along with the goal of not to be falling behind the curve. Yet, if growth and inflation are compromised because of less favorable credit and liquidity conditions, the Fed may need to reassess its policy path. As a reminder, the Fed is currently planning to reduce its $4.5 trillion balance sheet; with a projected annualized reduction pace of $600bn by Q4 of 2018.
In conclusion, we remain opportunistic and selective in our capital allocation. A less accommodative liquidity backdrop will likely keep asset price volatility in a higher range than the recent cycle lows. We seek to capitalize on any monetary or fiscal policy mis-steps. From a bottoms-up perspective, we continue to focus on security selection in both the equity and fixed income spectrums; with a bias towards dividend growth, healthy balance sheets, industry leaders and visible earnings profiles.
Christos Charalambous CFA
Senior Strategist
christos.charalambous@edgewealth.com
Please remember that past performance may not be indicative of future results. Different types of investments involve varying degrees of risk, and there can be no assurance that the future performance of any specific investment, investment strategy, or product made reference to directly or indirectly in this newsletter (article), will be profitable, equal any corresponding indicated historical performance level(s), or be suitable for your portfolio. Due to various factors, including changing market conditions, the content may no longer be reflective of current opinions or positions. Moreover, you should not assume that any discussion or information contained in this newsletter (article) serves as the receipt of, or as a substitute for, personalized investment advice from Edge Wealth Management, LLC. To the extent that a reader has any questions regarding the applicability of any specific issue discussed above to his/her individual situation, he/she is encouraged to consult with the professional advisor of his/her choosing. A copy of our current written disclosure statement discussing our advisory services and fees is available for review upon request.