Yield Curve Signaling Rate Path Uncertainty
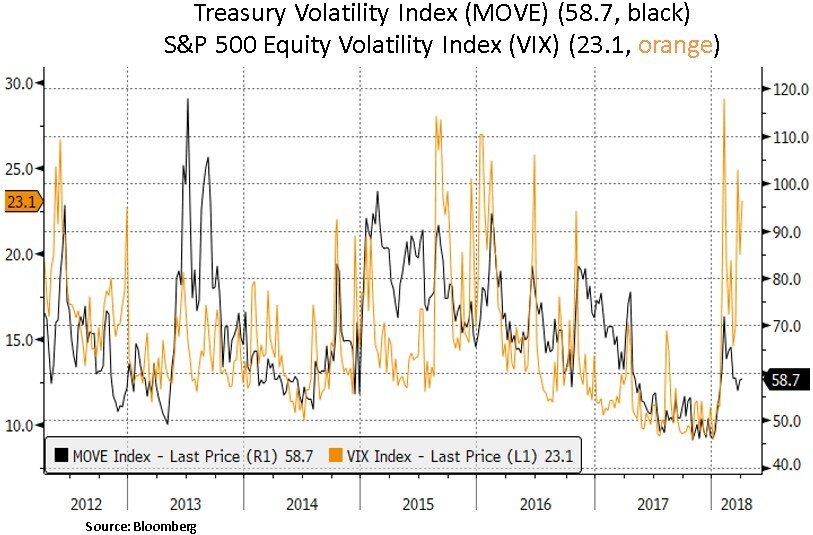
Financial markets have witnessed in the past month a backdrop of easing global sovereign bond yields, Treasury yield curve flattening and a softening in global economic surprise indicators. Moreover, trade skirmishes between the U.S. and China have contributed to a divergence between Treasury rate and equity volatility indicators - the ratio of implied equity to rates volatility is near historic highs. We note that U.S. tariffs cover just 2.6% of China's exports and China has proposed counter-tariffs of just $3bn on U.S. imports. While U.S. Treasury markets and real interest rates have settled down somewhat, LIBOR (interbank benchmark lending rate) has continued to rise, and corporate credit spreads have widened. On the U.S. equity front, high growth/price momentum equities (e.g. within the Technology sector) have recently underperformed. From our perspective, we retain our value conscious approach with an equity preference towards dividend growers and quality corporate balance sheets. As we head into the Q1 earnings season, investor focus will likely be on the longevity of the current U.S. corporate profit cycle; particularly after the recent U.S. tax reform.
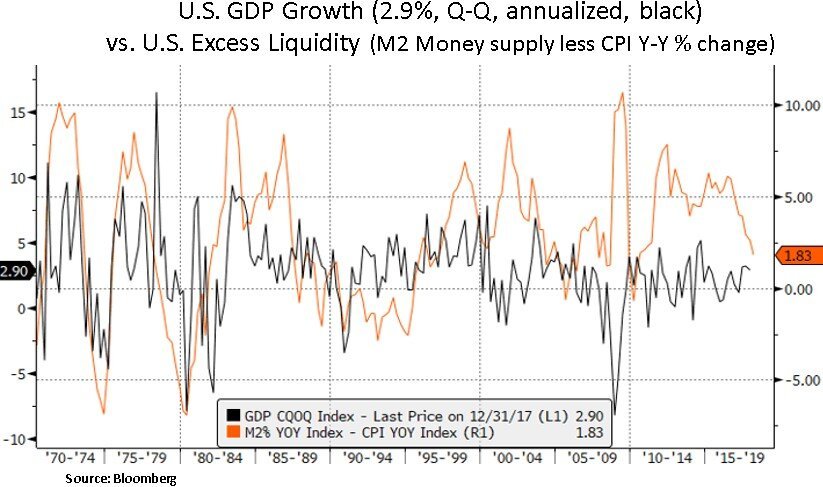
In the near-term, a robust U.S. earnings season could be a positive catalyst that eases some of the recent pick-up in equity volatility and intra-sector equity correlations. As we look ahead though, for the rest of the year and beyond, credit and liquidity conditions will likely drive investor risk appetite. In our view, signals from the U.S. yield curve will likely indicate if the Fed is overtightening; particularly as the Fed ramps up the reduction of excess reserves by Q4 of 2018 and global Central Bank balance sheets begin contracting collectively at the beginning of 2019.


Even though consumer borrowing costs are on the rise (particularly LIBOR and floating rate linked credit instruments), consumer balance sheets are in a reasonable shape and the recent tax cuts should be a mitigating factor as incomes grow. As we can see below, household debt and debt service costs are not excessive vs. personal disposable income. One could argue that U.S. unemployment rates are ‘as good as they get’ with potential inflationary impacts, but we note that labor force participation rates are not extended i.e. there may be more pockets of consumer demand as key labor cohorts (such as the 25-54 years cohort) return to the labor force.
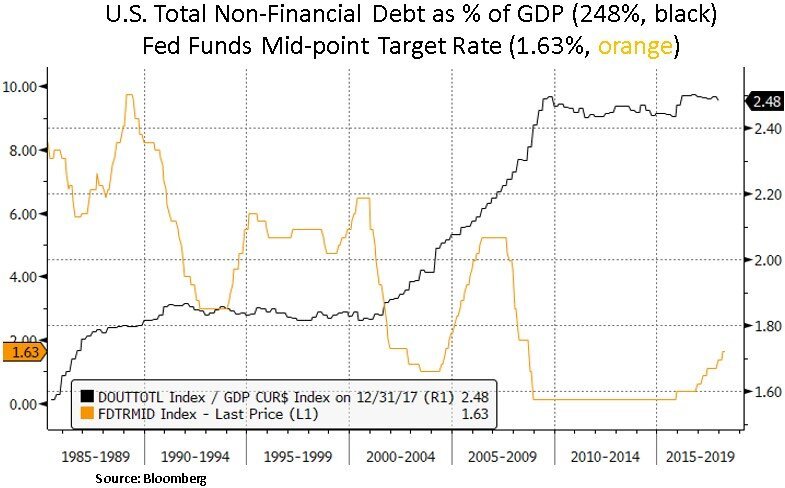
On the enterprise demand front, we remain constructive on leading tech names exposed to enterprise equipment and software – particularly industry leaders with exposure to secular growth themes such as cloud computing, big data analytics, artificial intelligence and quantum computing. Even though ISM manufacturing new orders have eased recently from cycle highs, they remain at a healthy level. We also remain constructive on leading healthcare names that are exposed to innovative treatments such as immunoncology and rising emerging market demand for healthcare. Within the energy sector we favor mega-cap names that have ample cash flow, organic growth potential and scope to ramp up shareholder returns; as energy prices have recovered well above production break-even levels. We also note that 43% of S&P 500 revenues are still derived from outside America. In our view, tightening financial conditions and the shape of the U.S. yield curve will eventually influence the Fed’s monetary policy path and consequently will likely weigh on the U.S. dollar – which is earnings positive for U.S. multinationals. As the U.S. fiscal outlook becomes from strained with rising budget deficits, we believe there are limits to the Fed’s tightening path; especially as the broader credit system still carries historically elevated levels of leverage.


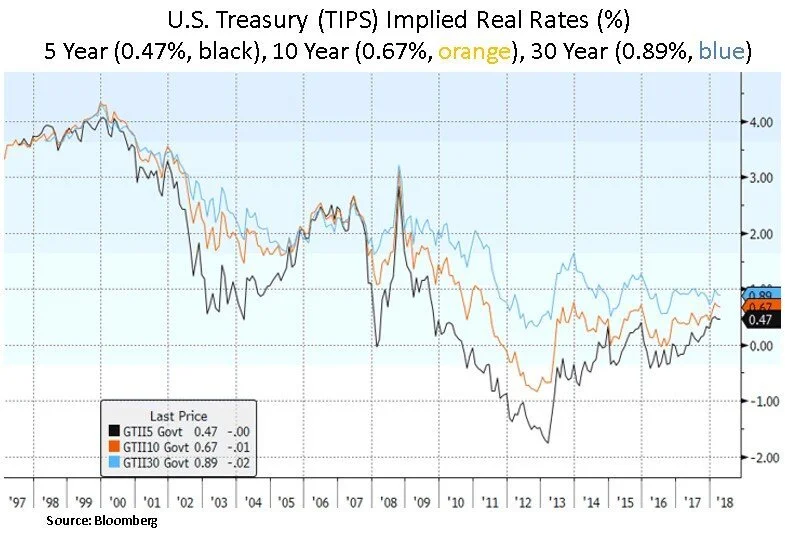
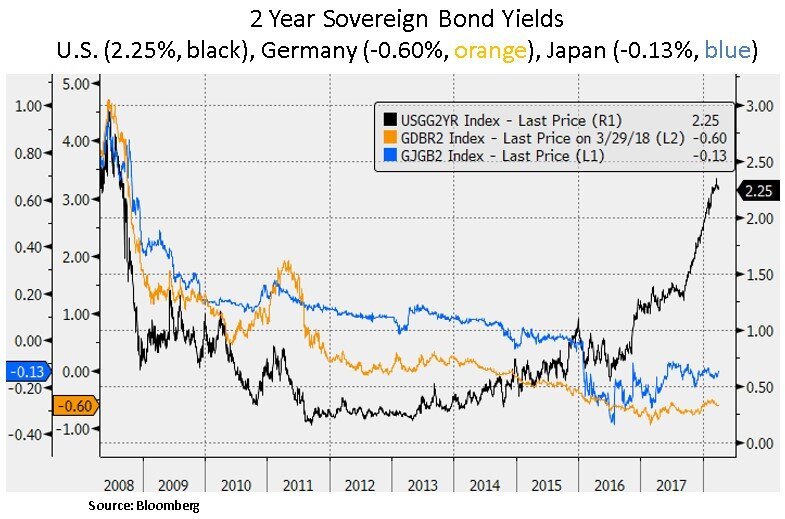
Lastly, we highlight below that long-term U.S. inflation adjusted or ‘real’ borrowing costs remain relatively accommodative. As discussed earlier, a flat or inverted yield curve may act as a check to real borrowing costs. For income-oriented investment strategies, low real rates are likely to be a positive long-run catalyst; particularly as a retiring Boomer generation and underfunded pension funds seek sources of sustainable income generation. We also note that key global sovereign yields remain suppressed. This backdrop will likely change as Central Banks such as the ECB and the Bank of Japan withdraw from quantitative easing – but this material yield gap likely creates a relative lid for U.S. Treasury yields in the interim. Thus, income generation remains a key component in our security selection.
In conclusion, as we navigate a higher equity volatility backdrop, we continue to be selective and focused on valuation and income generation. As credit and liquidity conditions tighten, we believe the shape of the Treasury yield curve is indicating a degree of uncertainty for the path of interest rates. A further flattening or inversion of the Treasury curve will likely be a headwind for the Fed’s tightening path. We look to deploy more capital if potential policy errors create favorable opportunities throughout 2018 and beyond.
Christos Charalambous CFA
Senior Strategist
christos.charalambous@edgewealth.com
Please remember that past performance may not be indicative of future results. Different types of investments involve varying degrees of risk, and there can be no assurance that the future performance of any specific investment, investment strategy, or product made reference to directly or indirectly in this newsletter (article), will be profitable, equal any corresponding indicated historical performance level(s), or be suitable for your portfolio. Due to various factors, including changing market conditions, the content may no longer be reflective of current opinions or positions. Moreover, you should not assume that any discussion or information contained in this newsletter (article) serves as the receipt of, or as a substitute for, personalized investment advice from Edge Wealth Management, LLC. To the extent that a reader has any questions regarding the applicability of any specific issue discussed above to his/her individual situation, he/she is encouraged to consult with the professional advisor of his/her choosing. A copy of our current written disclosure statement discussing our advisory services and fees is available for review upon request.