Higher Valuation Bars and Liquidity Hurdles in 2018
Financial markets witnessed a fundamental backdrop in 2017 that featured firmer global GDP growth, material Central Bank liquidity injections, tight corporate credit spreads, subdued asset price volatility and a recovery in inflation expectations. The above set of factors, impending U.S. tax reform and Fed policy normalization have contributed to a further flattening of the U.S. Treasury yield curve. The 2-10 Year Treasury yield spread is now at 0.54%; the lowest level in 10 years. Tightening global labor markets and a recovery in oil prices point to a likely medium-term stabilization in 2018 inflation metrics. On the U.S. equity front, secular and cyclical forces led to the technology and healthcare sectors’ outperformance in 2017. U.S. tax reform has also benefited corporations with heavier domestic tax exposure. As we consider 2018, with historically elevated valuations and equity market positioning, we remain selective in our equity selection, with a preference for corporations that feature strong balance sheets, dividend growth and resilient earnings profiles. At the sector level, we highlight the energy sector as a likely beneficiary of tighter global oil inventories and a lower U.S. corporate tax rate.
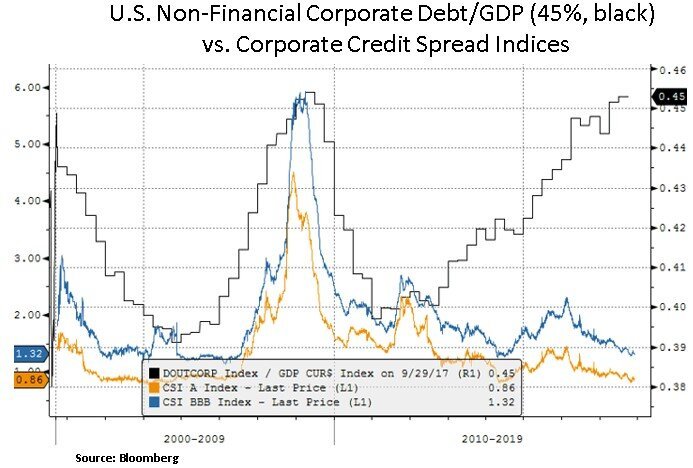
The main macro paradox in 2017 has been the loosening of financial conditions despite ongoing Fed interest rate increases and the commencement of ‘quantitative tightening’ i.e. a passive reduction in its balance sheet. One explanation is the fact that despite assuming more debt in the current credit cycle, the corporate sector has maintained a financial surplus and hence a reduced reliance on debt market access. Yet, as we consider 2018 and beyond, the question is whether the current yield curve flattening is foreboding a credit cycle slowdown by the end of 2018; as Global Central Banks are tightening on the back of a firmer inflation backdrop (which includes both asset and consumer prices). Thus, a coordinated 2018 global Central Bank liquidity withdrawal and a deceleration in credit creation should lead to a cyclical pick-up in asset volatility that will enable us to deploy capital more aggressively.
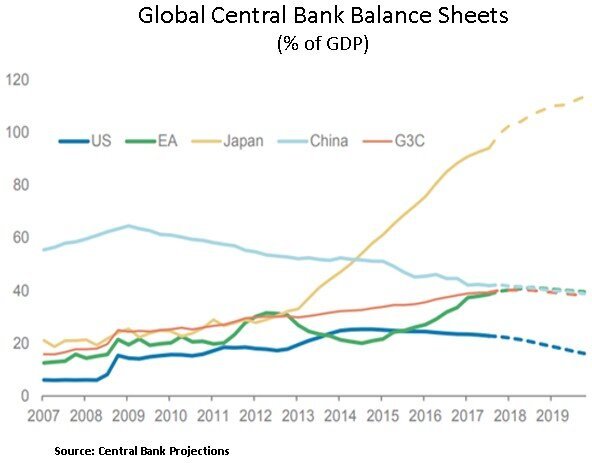


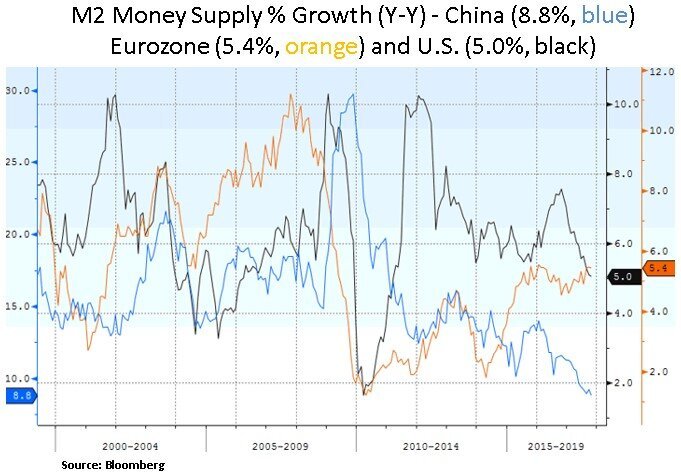
As discussed in our recent articles, global money supply growth measures have been decelerating; particularly in the U.S. and China. A firming of inflation expectations is likely to keep Central Banks on track for liquidity withdrawals in 2018-2020 and thus a likely contraction in monetary bases. The Fed has started in October of this year by allowing its balance sheet to shrink by $10 billion per month (total) of mortgage and government bonds, and will gradually increase the reductions to $50 billion per month, or $600 billion per year. It's important to realize that the Fed envisions doing this at a time when Federal deficits are likely to be rising in the next few years. This normalization path is likely to pose headwinds to the economy and financial markets. Thus, we look to be opportunistic in deploying capital as financial markets experience episodes of mean reversion in asset volatility.
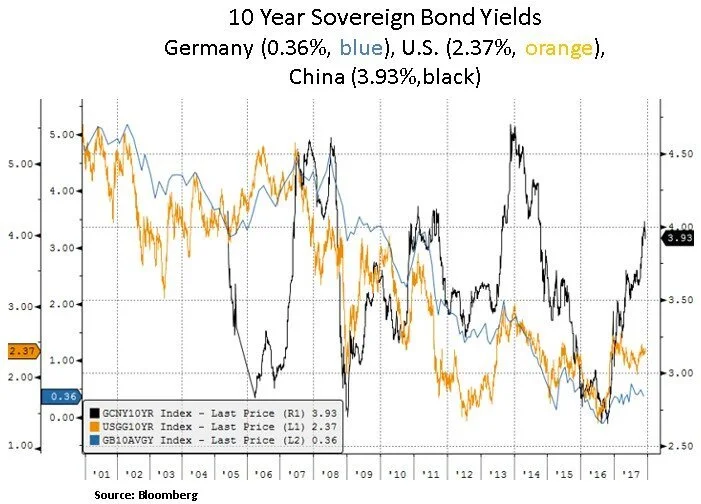
Perhaps more crucially for global GDP growth, is the ongoing decline in China’s credit expansion and the recent divergence of the Chinese 10 Year sovereign bond yield from its global peers. At a time whereby U.S. investors are focused on a ~$1.5 trillion U.S. fiscal tax program over the next 10 years, one should really be paying more attention to the pace of China’s annual credit growth. China accounts for ~30% of M2 money supply globally. Global reflation and U.S. tax reform have been dominant themes in 2017 with cyclical equities outperforming defensive sectors. Yet, as we enter 2018, further Chinese rebalancing away from investment and toward consumption is likely to be a key determinant of a slower but albeit more stable Chinese GDP growth rate. From a portfolio perspective, a slower credit backdrop in China may give rise to volatility in cyclical industries and equities exposed to global secular growth themes e.g. industrial automation, cloud computing, e-commerce, rising global healthcare demand and consumer exposure to expanding emerging market incomes.
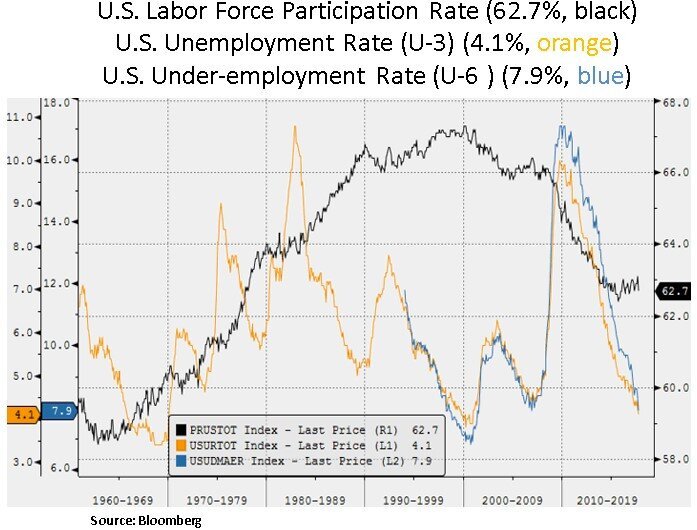
Lastly, we highlight below a scenario which may be a curveball to the Fed’s normalization path i.e. an insufficient demand backdrop due to slow U.S. labor force expansion. As we can see below, U.S. labor force growth is running at just 0.5%. Cyclically we are approaching full employment and demographic headwinds may lead to a lower labor force participation rate. Despite a moderate benefit to U.S. GDP growth (~0.3% in 2018) from fiscal stimulus, it remains to be seen if corporations will invest in capital expenditures and labor or whether they will engage in capital return programs and/or partial debt paydowns. Therefore, even though the consensus view is for monetary policy normalization, the real acid test in 2018 is whether the current U.S. GDP growth outlook will be sustained.


In conclusion, at a time of historically elevated asset valuations in equities and fixed income (and subdued financial market volatility), we look to be opportunistic in 2018 in deploying capital more aggressively. As global Central Banks stay the course on their policy normalization path, the pace of credit creation is likely to lead growth/inflation expectations, along with outlooks for the corporate profit cycle; especially after 8 years in the current economic recovery. From a bottom-up perspective, we look for value opportunities in equities that have had specific overhangs or in industries such as energy that have further cyclical upturn potential.
Christos Charalambous CFA
Senior Strategist
christos.charalambous@edgewealth.com
Please remember that past performance may not be indicative of future results. Different types of investments involve varying degrees of risk, and there can be no assurance that the future performance of any specific investment, investment strategy, or product made reference to directly or indirectly in this newsletter (article), will be profitable, equal any corresponding indicated historical performance level(s), or be suitable for your portfolio. Due to various factors, including changing market conditions, the content may no longer be reflective of current opinions or positions. Moreover, you should not assume that any discussion or information contained in this newsletter (article) serves as the receipt of, or as a substitute for, personalized investment advice from Edge Wealth Management, LLC. To the extent that a reader has any questions regarding the applicability of any specific issue discussed above to his/her individual situation, he/she is encouraged to consult with the professional advisor of his/her choosing. A copy of our current written disclosure statement discussing our advisory services and fees is available for review upon request.