Treasury Yield Curve Continues to Flatten
Financial markets continue to witness a backdrop that features synchronized global GDP growth, low asset price volatility and broadly loose financial conditions. The latter is taking place despite four interest rate hikes and the commencement of quantitative tightening (QT) by the Federal Reserve. Financial conditions metrics have not tightened as corporate credit spreads remain historically subdued, asset prices are at or near historic highs and the U.S. private sector continues to run a financial surplus amounting to 3.6% of GDP. We also note that U.S. real interest rates remain in check and European sovereign bond yields had a notable decline in the past month. The recent ECB meeting projected a paring back of ECB stimulus in 2018 (from EUR 60bn to 30bn/month) but the asset buying program remains open ended. Ironically, this is taking place as oil prices have staged an impressive rally e.g. Brent crude oil is up 42% since the June lows; largely on better OPEC supply compliance and increasing Middle East geopolitical risks. On the U.S. fiscal front, market expectations are focusing on a $1.5 trillion U.S. tax reform plan over the next 10 years. Some uncertainty remains however pertaining to revenue raising components of the Trump plan e.g. state and local deductions and mortgage interest deduction for individuals.
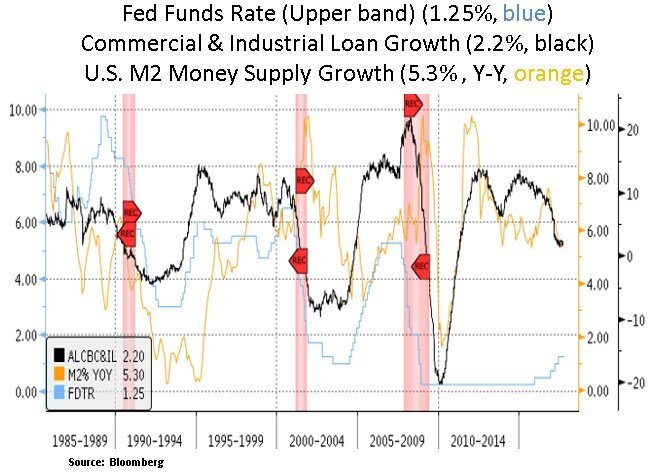
As we look into 2018, market participants are focusing on the ongoing flattening of the U.S. Treasury yield curve. Traditionally, a flattening of the yield curve would point to a future growth/inflation slowdown as the market sees excessive Fed monetary policy tightening. As the current economic expansion is the 3rd largest on record, there may be some validity in not expecting robust growth in the later part of this cycle. One complicating factor in this debate is the impact of global sovereign bond yields on U.S. Treasurys i.e. low European and Japanese yields capping long-term U.S. Treasury yields. In our view, the real acid test is the pace of U.S. and global credit/money creation. U.S. M2 money supply has seen a notable decline in the past 12 months, along with a decline in commercial and industrial loan growth from 8.7% to 1.1% currently. It is plausible that as the Fed reduces its monetary base in the first nine months of 2018, money supply growth could dip in negative territory; leading to tighter credit conditions.

Given the above money supply discussion, we continue to see risks to the Fed’s plan to raise interest rates four times in 2018 at 0.25% increments. Market participants also have more restrained hiking expectations than the Fed for 2018 and beyond. From the Fed’s perspective, inflation expectations are likely to pick up as the U.S. labor force tightens and loose financial conditions metrics gives them room to raise more dry powder in anticipation of the next cyclical downturn. As asset valuations are historically elevated, discussion of financial instability may also enter the Fed’s policy normalization rhetoric. Thus, as the Fed proceeds with its quantitative easing (QE) exit and as other Central Banks eventually normalize in 2018-2019, we should expect some mean-reversion in asset price volatility; particularly if the pace of global credit creation shows signs of deceleration.
From a portfolio perspective, we continue to remain selective in our security selection. We seek to opportunistically add income generating instruments and equity exposure with industry leading companies that have secular growth potential (e.g. technology and healthcare) or cyclical recovery potential (e.g. energy multinationals). We note that the most recent earnings season saw ongoing earnings momentum in mega-cap technology names e.g. Microsoft, Google, Apple and Intel. We like their industry positioning in secular growth themes such as cloud computing, artificial intelligence, machine learning and big data analytics. Another insight from the recent earnings season was the increasing mention on management conference calls of labor shortages. Broadly speaking, our portfolio has low labor exposure and lower wage pressure sensitivity. As we can see below, the labor market seems to have reached a natural range of unemployment. As discussed in prior notes, looking ahead in future years, demographic issues and increasing skills gaps could keep the unemployment rate and the absolute rate of labor force growth in historically low ranges. Hence our long-term belief is that long-term interest rates should stay in a historically low range. This long-term view bodes well for income generating security demand; particularly as many U.S. pension funds remain underfunded – the current pension scheme shortfall is estimated to be ~$4 trillion.
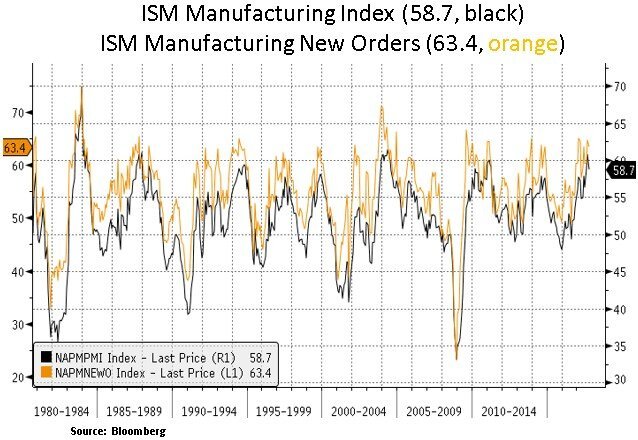
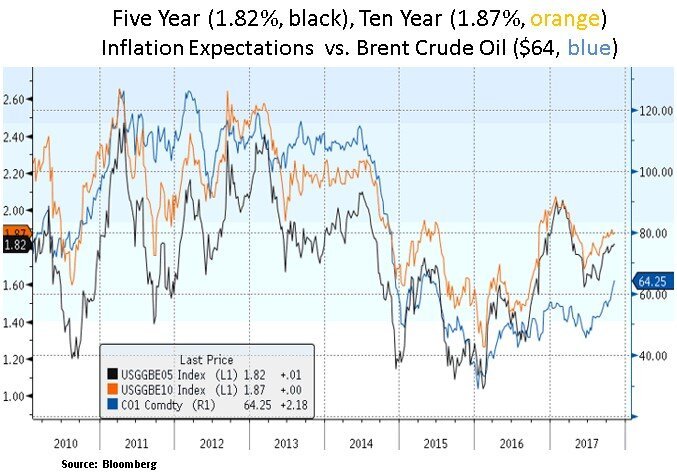
Lastly, we highlight below the relatively narrow recent range for inflation adjusted or ‘real’ Treasury yields. As with nominal Treasury yields, the ‘real’ yield curve has also been flattening; largely due to a trickle down in long-term yields. From a business cycle perspective, the current U.S. capacity utilization does not point to near-term inflationary risks i.e. in terms of a need to invest heavily in capital equipment. Despite recent momentum in U.S. manufacturing indicators (see page 1), broader industrial production remains tepid at 1.6% Y-Y growth rate. Thus, aside some pockets of wage inflation, we do not see a grave inflation headwind. As discussed earlier, it’s likely that the pace of credit creation in 2018 will lead the pace of U.S. GDP growth and hence inflation change.


In conclusion, the current market backdrop continues to feature low asset price volatility, loose financial conditions and historically elevated valuations in both equity and fixed income markets. Low intra-sector correlations give us better opportunities for individual stock-picking but in terms of an aggressive capital allocation we need to see some pick-up in volatility across key asset classes to invest in more favorable risk-reward opportunities. We look for any policy errors in both fiscal and monetary policies as potential risk episodes.
Christos Charalambous CFA
Senior Strategist
christos.charalambous@edgewealth.com
Please remember that past performance may not be indicative of future results. Different types of investments involve varying degrees of risk, and there can be no assurance that the future performance of any specific investment, investment strategy, or product made reference to directly or indirectly in this newsletter (article), will be profitable, equal any corresponding indicated historical performance level(s), or be suitable for your portfolio. Due to various factors, including changing market conditions, the content may no longer be reflective of current opinions or positions. Moreover, you should not assume that any discussion or information contained in this newsletter (article) serves as the receipt of, or as a substitute for, personalized investment advice from Edge Wealth Management, LLC. To the extent that a reader has any questions regarding the applicability of any specific issue discussed above to his/her individual situation, he/she is encouraged to consult with the professional advisor of his/her choosing. A copy of our current written disclosure statement discussing our advisory services and fees is available for review upon request.