Central Bank Normalization Approaching a Pivotal Point
Financial markets are navigating through a low volatility environment and a steady global growth setting. This month marks the 100th month in the current U.S. economic cycle. Despite the Fed staying on course for its $4.5 trillion balance sheet contraction and further interest rate hikes in Dec 2017 and into 2018, broad U.S. financial conditions and global liquidity flows remain accommodative. Expectations for tax reform and fiscal easing have also increased, even though the final cost of deficit spending will likely be reined in by Congress; the latter favors a ~$1.5 trillion tax package vs. a $3-4 trillion Trump tax plan over the next decade. As the size and timing of a fiscal package may still be up for debate, the question arises as to how the Fed would react to a fiscal package at a time of tightening labor market conditions. As we look ahead into 2018, the bigger picture question is how the global liquidity and credit cycles shape up; as 2018 will likely see coordinated global Central Bank tightening. Such a monetary policy turning point should be viewed in the context of advanced credit cycles (e.g. U.S. and China), historically subdued corporate credit spreads and elevated global asset prices. From our perspective, any policy missteps would be opportunities to deploy capital more aggressively at more favorable valuation entry points.
As we can see below, the U.S. Treasury yield curve has continued to flatten; particularly after the Sept Fed meeting which led to a repricing in interest rate hike expectations. In our view, the Fed’s tightening path is likely to face roadblocks as core U.S. inflation dynamics still remain subdued and credit creation is showing decelerating signs. Even though household balance sheets are in a better shape after years of deleveraging, the corporate debt load has approached a historically high level. Therefore, the Fed will likely adjust its normalization path if domestic or global credit/liquidity conditions become less favorable. Given this prospect, we would welcome any policy induced back-up in Treasury yields that would likely create a buying opportunity across interest sensitive assets.

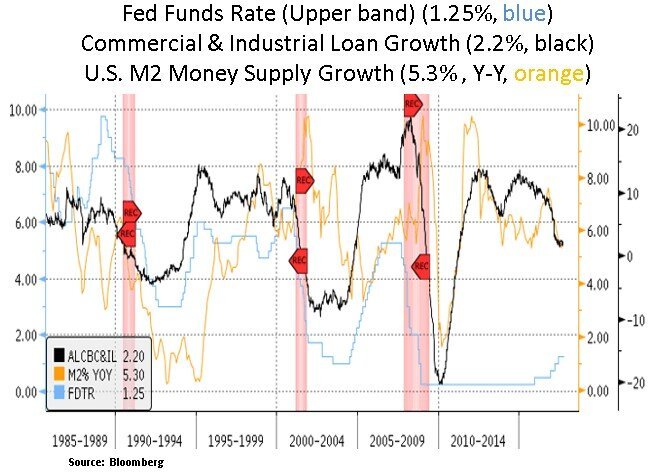


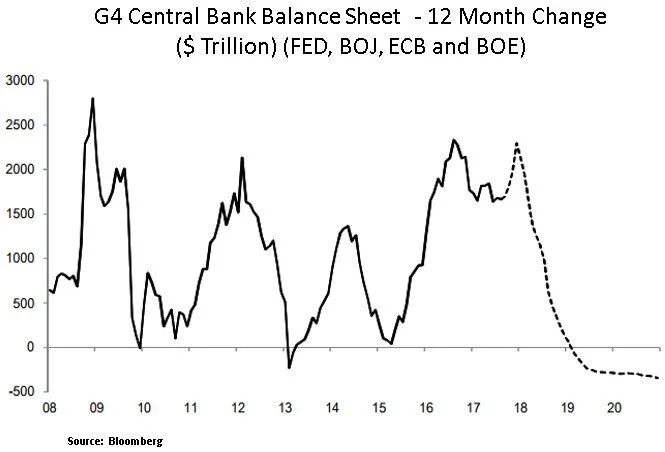
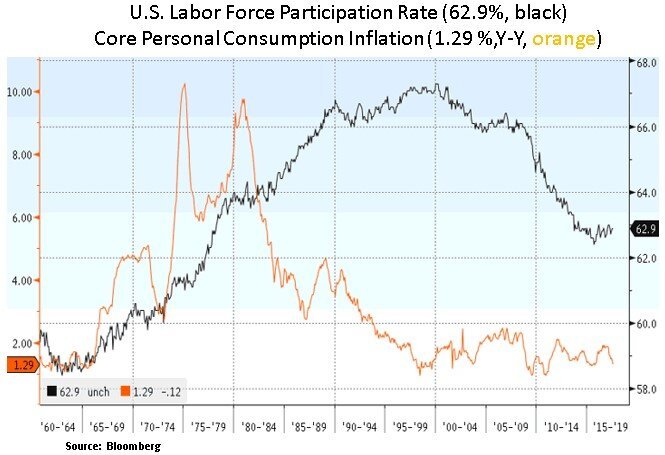
After more than $15 trillion in global Central Bank asset purchases since the 2008 financial crisis, we would view a coordinated global Central Bank liquidity withdrawal in 2018 as a likely trigger for pick-up in market volatility. A coordinated quantitative tightening (QT) scenario would likely undermine inflation expectations, which have recently rebounded along with energy prices. Yet, the personal consumption expenditures index, which is the Fed's main inflation gauge, remains stuck around 1.3% annualized, and in fact has been dropping this year. As expectations are increasing for increased deficit spending in the U.S., one would expect the Fed to be more mindful of any disruption in government borrowing costs. The Fed also faces certain structural factors that are weighing on U.S. and global inflation trends. These include increasing U.S. Federal debt levels, contracting unit labor costs, global competitive pressures and disinflationary impacts enabled by disruptive technological innovation e.g. automation, artificial intelligence and robotics.
Aging demographics are also likely to weigh on the U.S. labor force participation rate and inflation expectations, particularly as the Baby Boomer generation is starting to exit the labor force. From a portfolio perspective, we still see secular demand for income generating instruments and thematic exposures in industries that offer sustainable growth opportunities e.g. technology and healthcare sectors. We continue to lean on selective industry leaders that have balance sheet and dividend growth capacity; and clear competitive advantages.
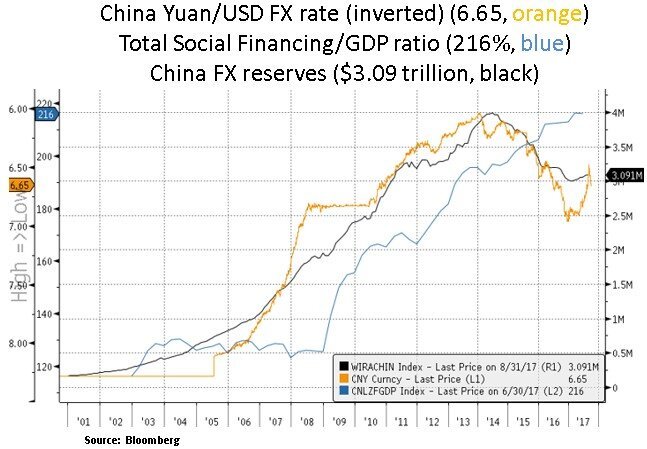
Lastly, we highlight below two important growth drivers for the current global economic expansion i.e. Chinese total social financing (TSF) expansion and increasing levels of global private sector debt. The latter is deemed to be a more efficient enabler of economic and productivity growth. Given historically elevated global debt levels, we expect Central Banks to closely monitor the global credit and liquidity cycles as we enter the 9th year in the current global economic expansion. We note that China has been effective in 2017 in implementing supply-side reforms and in stemming capital account and currency volatility. We expect China to opt for quality/greener GDP growth in their upcoming 19th Party Congress (Oct 18th) and gradual debt deleveraging for their state-owned enterprises and local government agencies. It remains to be seen what will be the impact on global growth as China and the PBOC attempt to rein in aggressive credit growth since 2009.


In conclusion, we remain selective in our capital allocation. At a time of subdued volatility, historically high asset values and a depressed yield environment, we are on the look-out for any policy missteps as a catalyst for a pick-up in bond and equity volatility. We continue to look for opportunities in income generating instruments and thematic exposures in industries that have above GDP trend growth potential.
Christos Charalambous CFA
Senior Strategist
christos.charalambous@edgewealth.com
Please remember that past performance may not be indicative of future results. Different types of investments involve varying degrees of risk, and there can be no assurance that the future performance of any specific investment, investment strategy, or product made reference to directly or indirectly in this newsletter (article), will be profitable, equal any corresponding indicated historical performance level(s), or be suitable for your portfolio. Due to various factors, including changing market conditions, the content may no longer be reflective of current opinions or positions. Moreover, you should not assume that any discussion or information contained in this newsletter (article) serves as the receipt of, or as a substitute for, personalized investment advice from Edge Wealth Management, LLC. To the extent that a reader has any questions regarding the applicability of any specific issue discussed above to his/her individual situation, he/she is encouraged to consult with the professional advisor of his/her choosing. A copy of our current written disclosure statement discussing our advisory services and fees is available for review upon request.