Low Core CPI Inflation Restrains the Fed's Rate Hike Path
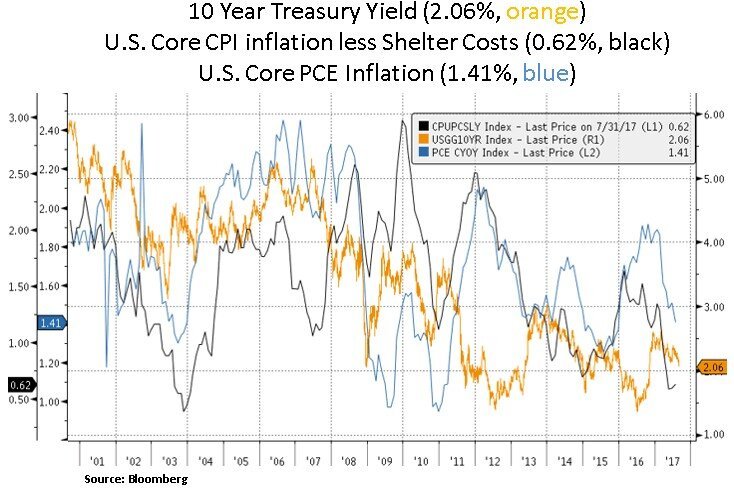
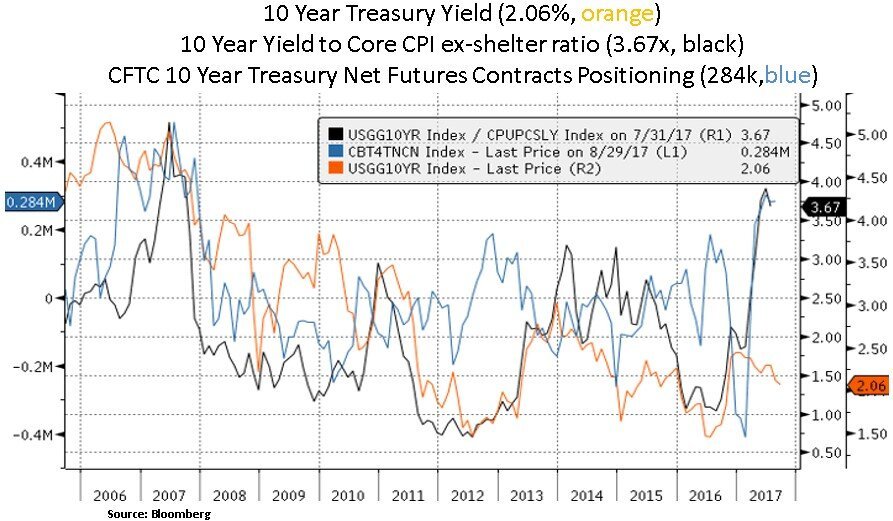
Financial markets are navigating a backdrop of improving global economic growth, lagging core inflation and declining Central Bank rate hike expectations. Fed rate hike expectations continue to decline and investors are forecasting a glacial pace of Fed rate hikes with a Fed funds rate of just 1.5% through January of 2020. The recent increase in the EUR/USD has pushed the odds of a rate hike by the ECB at the end of 2018 to the lowest on record. In our view, apart from geopolitical tensions and recent U.S. storm related growth concerns, the primary reason for declining U.S. Treasury yields in 2017 is lackluster inflation data. Specifically, more CPI items by number have been falling in price than rising (e.g. used vehicles, electronics, apparel) and this has led to a lower core CPI. The U.S. 10year bond yield is now at the bottom of its YTD trading range i.e. at 2.06%. Moreover, the Treasury yield curve (210-year yield spread) has flattened to a new cycle low. Forward curve flattening implies that the Fed is essentially done with rate hikes and there is also some uncertainty on the timing of balance sheet normalization. The odds for a Dec 13th, 2017 Fed meeting rate hike currently stand at 29%. On the fiscal side, the likelihood of a temporary resolution of the U.S. debt ceiling has increased. In terms of market positioning, we note that 10 Year Treasury long positioning remains elevated and USD index short positioning is close to a 5 year high. From an earnings perspective, USD weakness bodes well primarily for internationally exposed U.S. technology, healthcare and energy sectors.
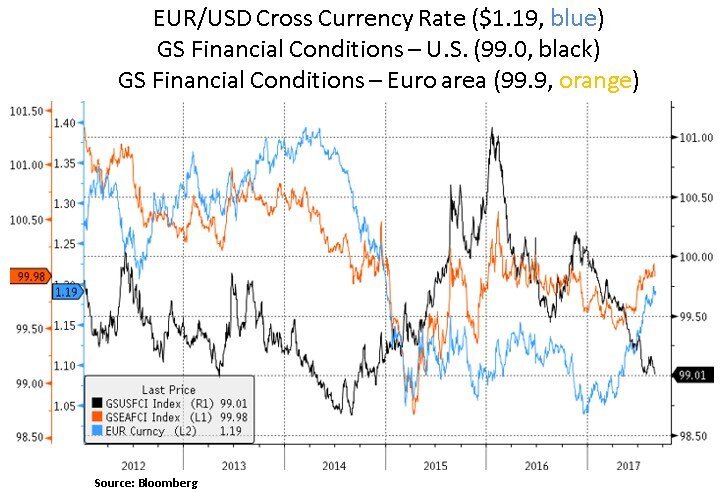
We highlight below that Euro area financial conditions have diverged from the U.S. due to the recent Euro strength. Despite healthy Eurozone GDP and inflation data, currency concerns will likely push the ECB toward a more dovish approach to winding down QE in 2018; as the Eurozone derives about half of its revenues from abroad. On the U.S. front, easy financial conditions (driven by a weak USD and high asset prices) give the Fed scope to tighten via balance sheet normalization; albeit at a very gradual pace due to the low core CPI overhang. As we can see below, both core PCE (the Fed’s favorite inflation measure) and core CPI excluding shelter costs have had meaningful declines in 2017.

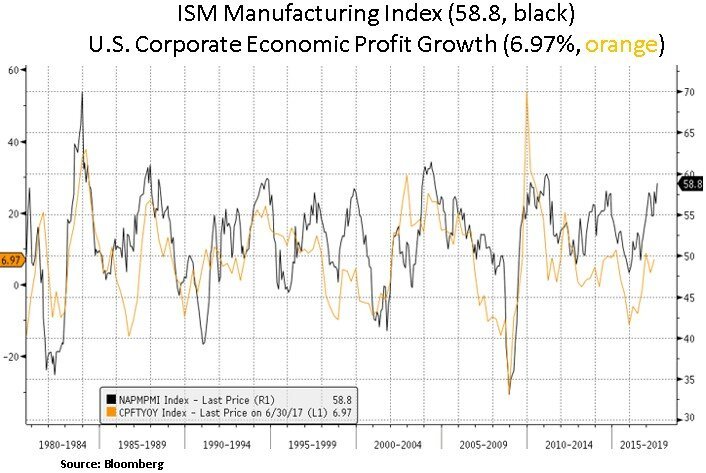
On a more positive note, we highlight the ongoing U.S. manufacturing momentum and rebounding U.S. corporate profit growth. U.S. profit margins are elevated in a historical context and the wage share of GDP is rebounding; which is putting gradual pressure on margins. From our perspective, equity sectors such as technology and healthcare have structurally low labor costs, high profit margins and better secular growth dynamics via higher international exposure. Within healthcare we note the recent repricing in biotechnology, driven by idiosyncratic factors and industry M&A activity (i.e. Gilead’s acquisition of cell therapy innovator Kite)
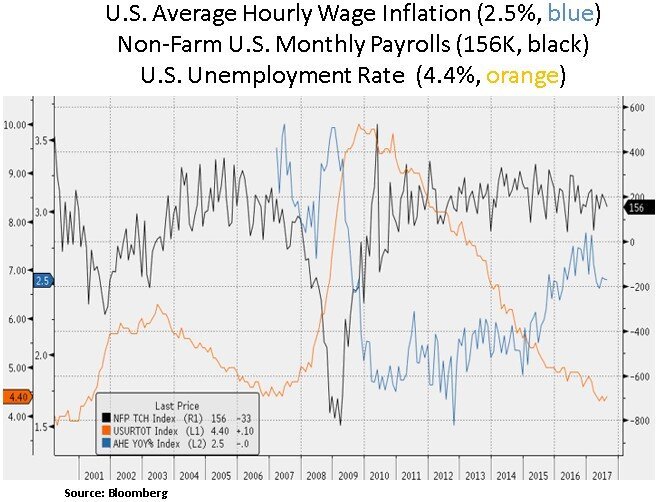
Regarding the U.S. labor market, there is an ‘as good as it gets’ sense with jobless claims near their best levels in this cycle, job vacancies near multi-year highs and the U.S. unemployment rate near the lowest level (4.4%) in the 8-year labor recovery. Viewed in isolation, tight labor markets would indicate a risk of rampant wage inflation. However, as discussed in our last commentary, demographic headwinds (Baby Boomer retirements) will likely weigh on the pace of labor force expansion and labor force participation rates. Thus, this will likely pose an ongoing headwind to broad aggregate demand and consumer driven inflation levels. From a portfolio perspective, a material back-up in Treasury yields and a widening of global corporate credit spreads would likely open a better buying opportunity for interest sensitive financial instruments.
As we consider consumer spending driven U.S. GDP growth in 2018, the Fed and investors will likely focus on the labor force growth and the shape of the U.S. consumer. Thus far in this economic cycle, consumer leverage has fallen, courtesy of rising asset prices and low rates. U.S. economic growth has become heavily dependent on consumer spending, which has been boosted, in aggregate, by increasing asset prices. That makes financial market volatility a risk for growth and by extension one half of the Fed’s mandate; to maintain full employment. The dependency of economic activity on asset prices has helped to shape Fed policy over the past few years. At the global level, Chinese credit conditions and China’s dependence on infrastructure spending will continue to garner the market’s attention. In our view, China remains the epicenter of global credit creation and a key reflation driver.
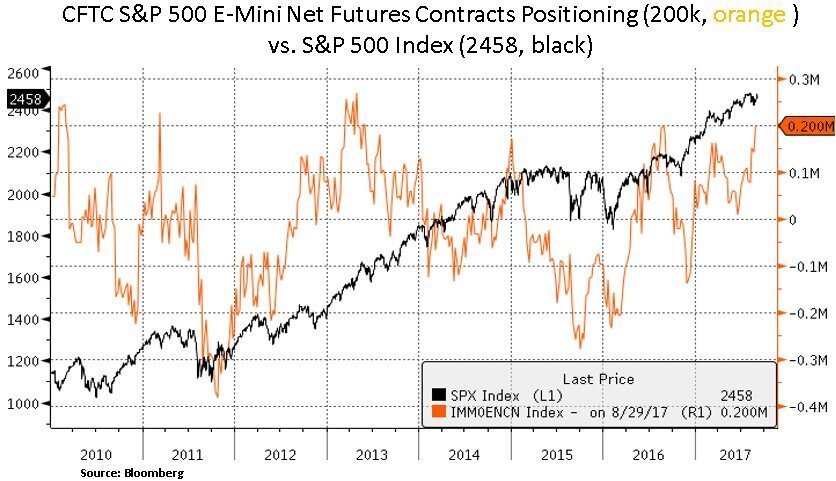
Lastly, we highlight below that speculative futures S&P 500 positioning increased towards the high end of the historical range. In addition, investor demand for leveraged S&P 500 exposure has increased. Certain quantitative/hedge fund strategies continue running elevated levels of U.S. equity leverage; given the firm market momentum and subdued volatility backdrop. From our perspective, extended positioning and increasing signs of leverage carries risks. Given historically elevated equity valuation levels and tight corporate credit spreads, we would be more aggressive allocators of capital upon a decent mean-reversion episode in cross-asset volatilities.


In conclusion, we continue to be selective in our security selection and capital allocation. We continue to favor mega-cap U.S. equities with more resilient balance sheets and earnings/dividend growth. We look to be nimble on specific ‘micro’ opportunities (e.g. management missteps) and on any risk-off episodes driven by policy errors; particularly given the increasing sensitivity of asset prices and credit markets to global monetary policies.
Christos Charalambous CFA
Senior Strategist
christos.charalambous@edgewealth.com
Please remember that past performance may not be indicative of future results. Different types of investments involve varying degrees of risk, and there can be no assurance that the future performance of any specific investment, investment strategy, or product made reference to directly or indirectly in this newsletter (article), will be profitable, equal any corresponding indicated historical performance level(s), or be suitable for your portfolio. Due to various factors, including changing market conditions, the content may no longer be reflective of current opinions or positions. Moreover, you should not assume that any discussion or information contained in this newsletter (article) serves as the receipt of, or as a substitute for, personalized investment advice from Edge Wealth Management, LLC. To the extent that a reader has any questions regarding the applicability of any specific issue discussed above to his/her individual situation, he/she is encouraged to consult with the professional advisor of his/her choosing. A copy of our current written disclosure statement discussing our advisory services and fees is available for review upon request.