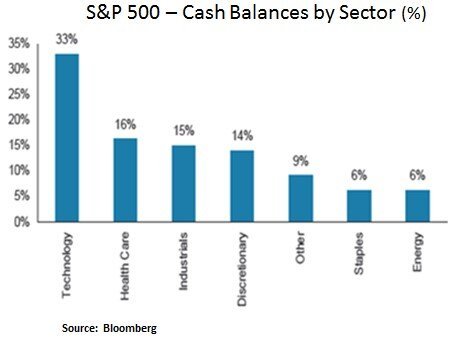
Corporate cash deployment is key for next cyclical leg
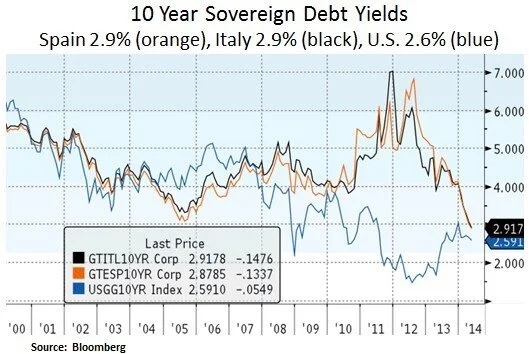
Global M&A activity has topped $1.2 trillion so far this year. This compares with $1.4 trillion in 2007. With available financing capacity and low borrowing costs, financial markets are witnessing a surge in M&A activity which historically has marked a peak in the credit cycle. This time around however, the Fed has yet to embark on a traditional interest rate hike cycle. Thus, this credit cycle could potentially be longer. Apart from tight corporate credit spreads, we are witnessing subdued borrowing costs at the sovereign debt level as well. In the U.S. the 10 and 30 Year Treasury yields are at 2.6% and 3.4% respectively. Perhaps more dramatically, in Europe, Spanish and Italian 10 Year sovereign yields are making fresh new lows at 2.9%; largely in anticipation of an ECB asset purchase program in June, aimed at low inflation levels. Therefore, the corporate sector across the Atlantic remains well positioned as we proceed to the more mature phase of the current business cycle. It is imperative however that we see more business investment and labor hiring; especially as global growth dynamics are still fairly challenged. From an investment perspective, we remain focused on income generating assets and equity investment themes in healthy end-markets. Such positioning is likely to continue to benefit from the ongoing U.S. equity market rotation from expensive ‘high flying’ names to large-cap equities which are offering better value and more consistent earnings growth.
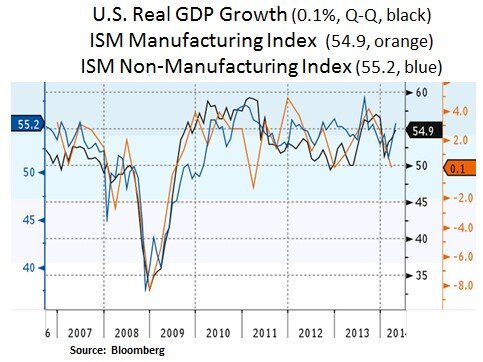
After disappointing U.S. GDP growth (0.1%) in the first quarter of 2014, various surveys point to a strong rebound in Q2 i.e. 3-4%. For the whole year, the OECD expects 2.6% U.S. GDP growth. Global growth is expected at 3.4%. In the U.S., apart from soft housing activity, most economic metrics remain stable. As financial conditions remain favorable and as the economy still operates below its potential, we probably have more room in the current business cycle. The energy sector remains a bright spot and corporate sector balance sheets remain well positioned; especially as they have rolled their debt to later maturities.

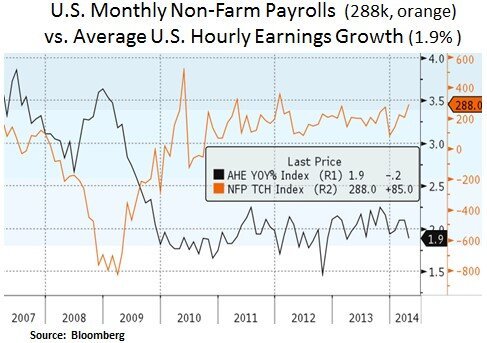
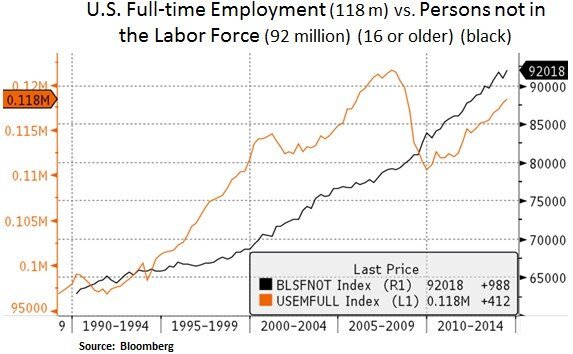
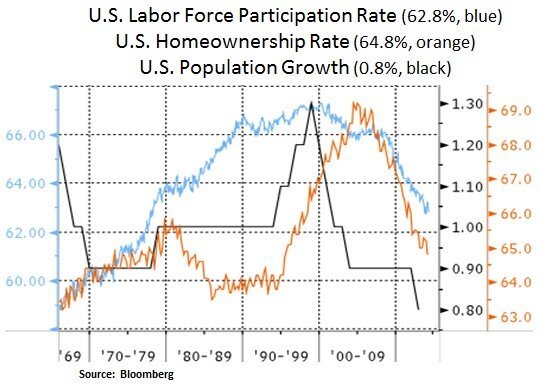
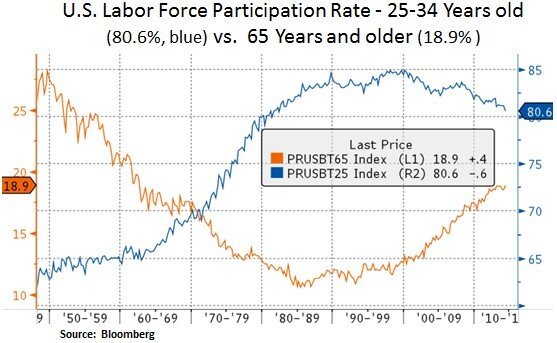
The U.S. labor market showed traction in April and labor costs remain in check. The latter has eased some labor cost inflation concerns. In our view, wage growth is likely to continue recovering but not at the same pace as previous recoveries. The Federal Reserve chairwoman Janet Yellen has recently voiced her concerns with regard to subpar wage growth; which is still below the ~3.5% level seen in the previous cycle. If we look below the hood, full-time employment is still below 2007 levels. The U.S. labor market has 118.4m full-time jobs, 27.3m part-time and 9.8m people are considered unemployed. Persons not in the labor force are reaching new highs. Labor force participation (62.8%) is at levels last seen in 1978. Baby Boomer retirements are a headwind as they exit the labor force. However, we are seeing labor force participation increase for the age cohort of 65 years and older. As we can see below, since 2000, higher participation by older people may have been weighing on younger age cohorts. In addition, couples getting married at a later age may also be impacting population growth and the homeownership rate. Therefore, demographics are an important topic that has real investment implications. Firstly, the above dynamics may keep labor cost inflation in check for longer than expected. Secondly, as Baby Boomers retire, demand for income generating securities is likely to remain robust. Thirdly, demand for healthcare services and medication will likely increase. Therefore, steady income generating instruments such as non-agency MBS, quasi-fixed income instruments and healthcare equities are likely to benefit from the above demographic trends.
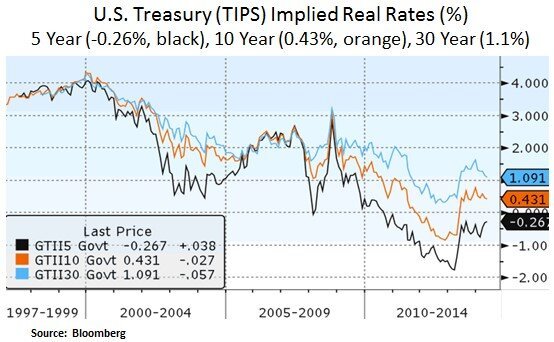
At the global level, we expect the low core inflation environment to continue; largely due to demographic trends and manufacturing overcapacity in Asia. In the medium-term, China is a pivotal economy to watch; as its credit and investment cycles appear to be turning. Therefore, the developed market sovereign debt markets seem to be pricing in a long-term low growth and inflation backdrop. From a technical perspective, we would highlight the relative scarcity of long-term sovereign instruments. In the Treasury market for example, if we exclude the Federal Reserve’s holdings, available long-term Treasuries beyond 10 year maturities are only 5% of the $12.1 trillion publicly traded Treasury market. Moreover, demand from pension funds remains high and other sovereign debt buyers like Japan are searching for long-term assets.


In conclusion, as long as inflation remains subdued, the corporate sector may continue to benefit from lower borrowing costs for longer than expected. From an investment perspective, we expect demand for income to remain a key focus for investors and a key part of our investment strategy. In equities, we favor secular growth themes such as healthcare, technology and selective industrials with healthy end-market demand e.g. commercial aerospace.
Christos Charalambous CFA
Senior Strategist
christos.charalambous@edgewealth.com
Please remember that past performance may not be indicative of future results. Different types of investments involve varying degrees of risk, and there can be no assurance that the future performance of any specific investment, investment strategy, or product made reference to directly or indirectly in this newsletter (article), will be profitable, equal any corresponding indicated historical performance level(s, or be suitable for your portfolio. Due to various factors, including changing market conditions, the content may no longer be reflective of current opinions or positions. Moreover, you should not assume that any discussion or information contained in this newsletter (article) serves as the receipt of, or as a substitute for, personalized investment advice from Edge Wealth Management, LLC. To the extent that a reader has any questions regarding the applicability of any specific issue discussed above to his/her individual situation, he/she is encouraged to consult with the professional advisor of his/her choosing. A copy of our current written disclosure statement discussing our advisory services and fees is available for review upon request.