U.S. housing recovery likely to continue at a moderate pace
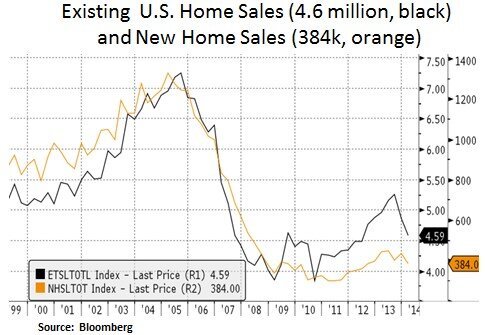
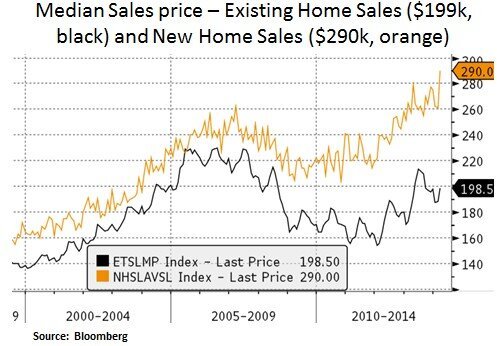
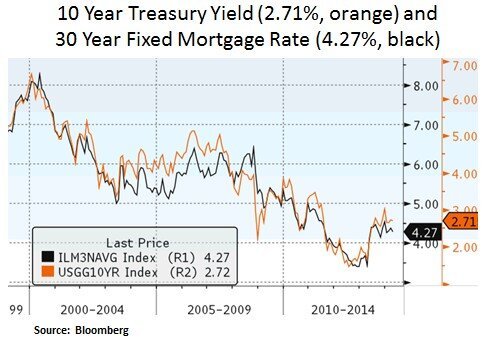
The U.S. housing market saw strong growth in 2012 and 2013, driven by investor flows and cash purchases. After dropping 35% since the mid-2006 peak, the Case/Shiller 20-City Home Price Index rose 23% since the beginning of 2012. First-time home buyers have accounted for 28% of existing home sales in 2013. In addition, 33% of existing home sales in 2013 were all-cash transactions and 25% were distressed sales. Since July of 2013, home sales activity has decelerated due to higher prices, stringent lending standards and a rise in borrowing costs i.e. from 3.45% in April of 2013 to today’s 4.27% on a 30-year fixed rate mortgage. Median sales prices have been climbing for both existing and new home sales as inventories have becoming tighter. Declining distressed sales for existing home sales and fewer new homes built account for the decline in inventories. Moreover, from a supply perspective, homebuilders have been increasingly complaining about the cost and availability of labor and land, along with higher building material prices. In our view, current supply shortages will likely keep home sale prices firm but probably at a mid-to-high single digit pace (vs. the 12% increase in 2013); especially as the recovery progresses from prime to peripheral areas. Thus, higher prices may incentivize housing inventory to come in the market but on the other hand, higher prices may dent investor and first-time homebuyer demand.
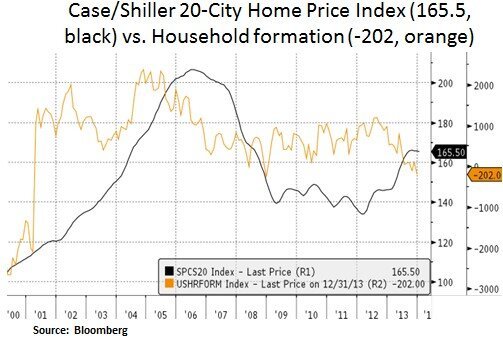

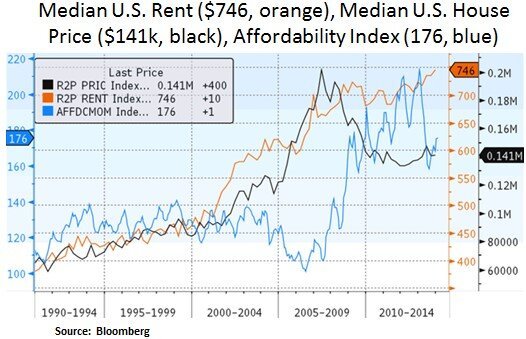
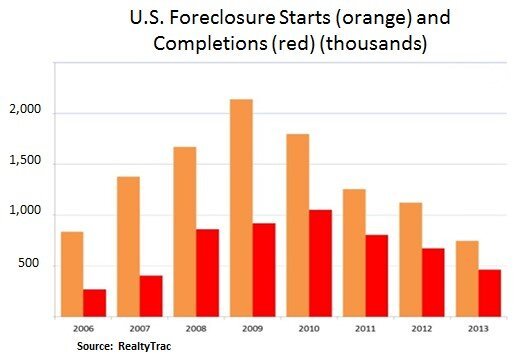
As we can see above, housing formation has been contracting in recent quarters, well below the historical average of 1.15 million. According to online real estate company Trulia, nearly 2.4m households have gone ‘missing’ since the crisis. Housing formation remains particularly low for young Americans. In addition, overall population growth for the U.S. has been declining in recent years; to 0.71% - a level last seen in 1937. Lower fertility rates and slower immigration account for most of the decline (from a 1.3% peak in 2000). Nonetheless, with fairly low borrowing costs on a historical basis and as the labor market continues to stabilize, we should see some pent-up demand to be released for housing. Since the housing downturn, more than 4 million homeowners have lost their homes to foreclosure and were forced to become renters or live with family members. As we can see below, rent inflation has been increasing. In fact, nationally, half of all renters are now spending more than 30% of their income on housing. Therefore, as the labor market and incomes continue to stabilize, we should see some renters becoming homeowners again; especially as national rental vacancy rates are at mid-1990s levels (to 7% from 11% in 2009). Conversely, homeownership has declined to 65% from 69% in 2007. Therefore, with housing activity still off multi-decade lows, we expect the housing recovery to continue.
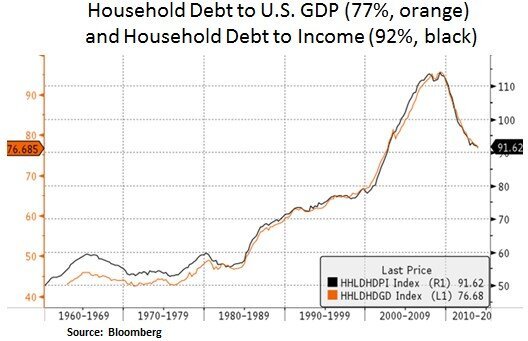
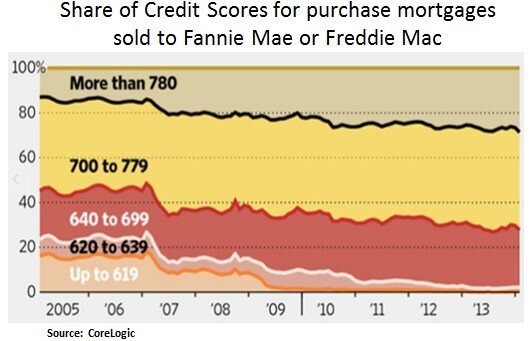
Household balance sheets have continued to improve, as households continued their deleveraging efforts and as the economic recovery enters its 5th year. With improved debt-to-income (DTI) credit, metrics households have some scope to take on new mortgage debt. The main headwind for first-time homebuyers seems to be concentrated in the younger age cohorts i.e. the 25-34 age cohort. As student debt has surpassed $1 trillion, younger households may be facing difficulty in qualifying for mortgages; especially as credit standards are still fairly tight. Nearly 40% of new borrowers last year had credit scores above 760 vs. 25% before the credit crisis.
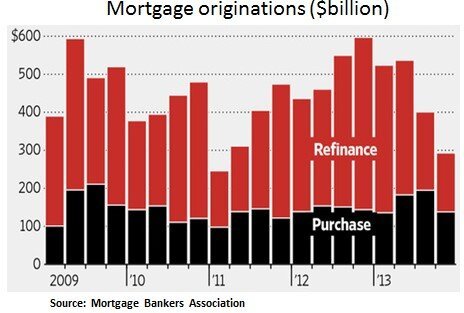
In terms of recent regulations such as the Qualified Mortgage (QM) rule - the QM rule has, no required minimums for the borrower's down payment or credit score. It sets a maximum of 43 percent for the borrower's debt-to-income (DTI) ratio but loans guaranteed by Fannie Mae/Freddie Mac/FHA have broad exemptions. Mortgage originations, which reached $1.8 trillion in 2013, are forecast to hit $1.1 trillion in 2014 by the Mortgage Bankers Association. Therefore, as household balance sheets improve and mortgage refinancing originations have declined, the banking sector may be incentivized to loosen its credit standards at this stage; in order to accommodate demand from first-time or other entry level homebuyers. Over the past year, more than one in six loans (~17%) made outside of the FHA included down payments of less than 10%.

In conclusion, the housing recovery is likely to continue at a moderate pace. The current supply/demand imbalance (tight inventories) is likely to keep prices firm. With affordability still favorable on a historical basis and as the labor market improves, we should see some pent-up demand being released for home purchases. From an investment perspective, we still favor our exposure to non-agency Mortgage Backed Securities (MBS). With elevated demand for yield, we view the sector as a steady source of income. As the housing recovery progresses, even lower default rates are likely to improve the loan loss severity profiles for our MBS portfolios.
Christos Charalambous CFA
Senior Strategist
christos.charalambous@edgewealth.com
Please remember that past performance may not be indicative of future results. Different types of investments involve varying degrees of risk, and there can be no assurance that the future performance of any specific investment, investment strategy, or product made reference to directly or indirectly in this newsletter (article), will be profitable, equal any corresponding indicated historical performance level(s, or be suitable for your portfolio. Due to various factors, including changing market conditions, the content may no longer be reflective of current opinions or positions. Moreover, you should not assume that any discussion or information contained in this newsletter (article) serves as the receipt of, or as a substitute for, personalized investment advice from Edge Wealth Management, LLC. To the extent that a reader has any questions regarding the applicability of any specific issue discussed above to his/her individual situation, he/she is encouraged to consult with the professional advisor of his/her choosing. A copy of our current written disclosure statement discussing our advisory services and fees is available for review upon request.