Diverging Asset and Consumer Inflation Cycles
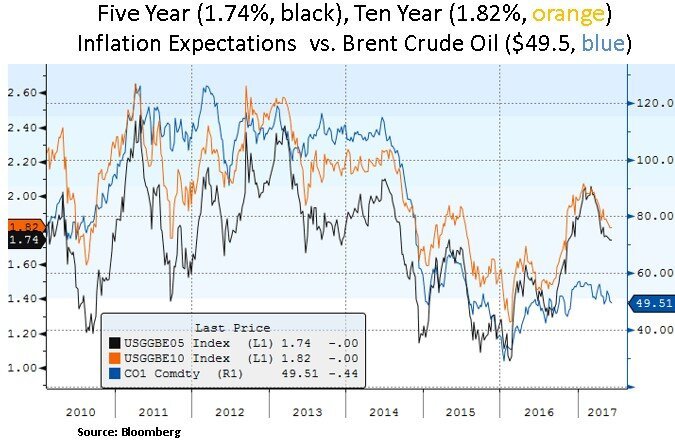
Financial markets have continued to witness in the past month further resilience in U.S. equities and persistently low equity volatility and correlation. Year-to-date, U.S. equities have performed as follows: S&P 500 +9.7%, DOW JONES +8.3% and NASDAQ +17.5%. Mega-cap technology equities have continued to narrowly lead the equity market to historic highs (e.g. Alphabet, Apple, Microsoft). The Treasury yield curve has been flattening with long dated bonds experiencing yield declines e.g. 10 Year Treasury Yield at 2.14% (from 2.35% a month ago). The decline can be attributed to lower inflation expectations on the back of subdued energy prices, in-check U.S. wage inflation and a sharp reversal in market positioning. The Treasury market continues to price in a shallower long-term interest rate path than the Fed’s projections. Despite a lackluster May jobs report, a June rate hike is still anticipated by the market but the pace of subsequent rate hikes is still in question. Market participants are increasingly shifting their focus to a ‘soft balance sheet taper’ scenario. The FOMC could bring forward the timing of the Fed balance sheet reinvestment taper by one quarter to Q4-17 along with a pre-announced schedule of increasing caps on the dollar amount that would not be reinvested by the Fed. The long-term goal appears to be a balance sheet reduction from $4.5 to $2.5 trillion.
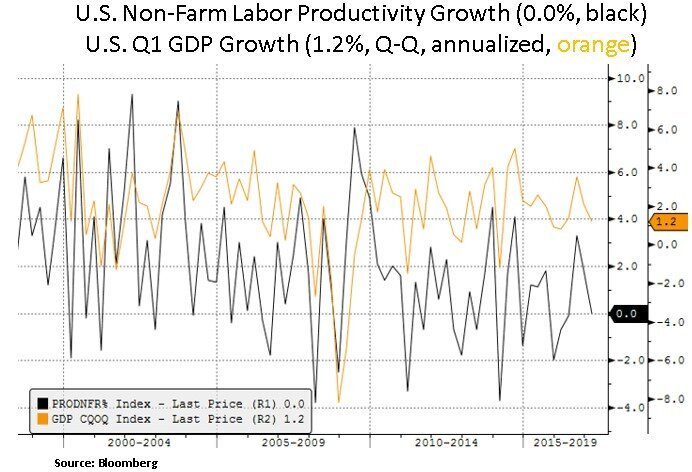
The challenge for the Federal Reserve is the ongoing dichotomy between financial asset performance and underlying U.S. economic growth. As we can see below, the labor market recovery is at an advanced cyclical stage (i.e. 4.3% U-3 unemployment rate) but it is becoming evident that structurally there is a mismatch between supply and demand of labor (e.g. record JOLTS job openings at 6 million). Without a material pick-up in labor force expansion and U.S. labor productivity, range bound GDP growth and inflation measures are likely to keep long-term rates in check. Hence, from a portfolio perspective, income generating instruments are likely to stay in demand.

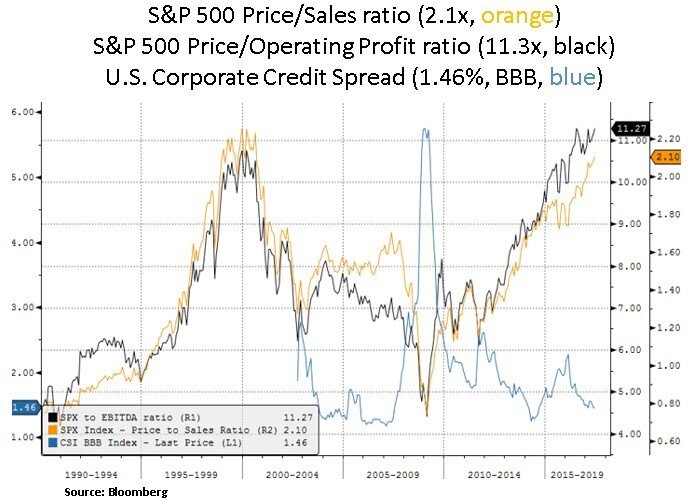
With easy financial conditions and tight corporate credit spreads, the Fed still has a window to increase its dry powder before the next cyclical downturn. Moreover, as other global central banks (e.g. ECB, BOJ) are still accommodative and global bond yields are generally subdued (e.g. 10 Year German and Japanese Sovereign yields at 0.25% and 0.03% respectively) the Fed can attempt to gradually wind down part of its balance sheet. We are however in a historically unchartered area. Global debt levels are historically high and asset valuations are likely to be more sensitive to changes in global monetary policies and Central Bank balance sheets. Thus, the pace of credit and liquidity injections is likely to determine the latter parts of the current global economic, asset and inflation cycles. Given elevated asset valuations and still lofty expectations for U.S. fiscal reform, we are still on the look-out for some mean reversion in U.S. equity volatility to deploy capital more aggressively. Our selective equity bias remains for competitive industry leaders with a focus on robust balance sheets and dividend growth.
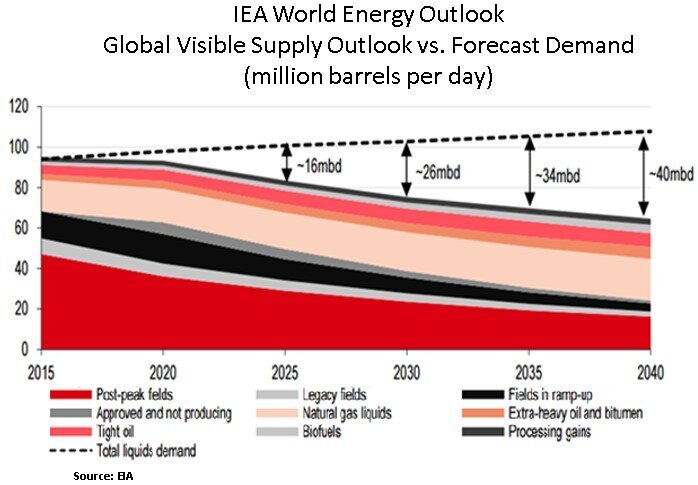
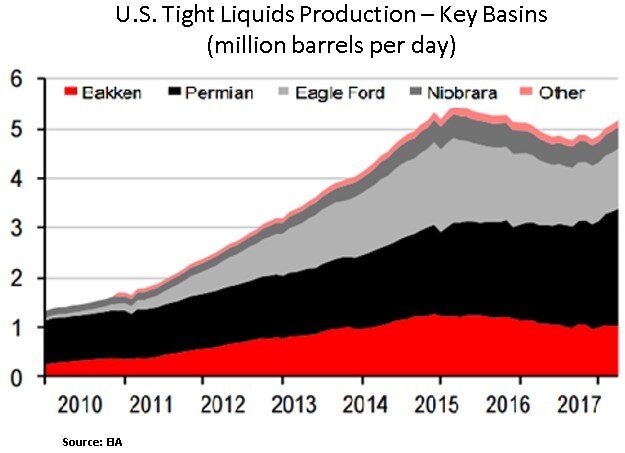
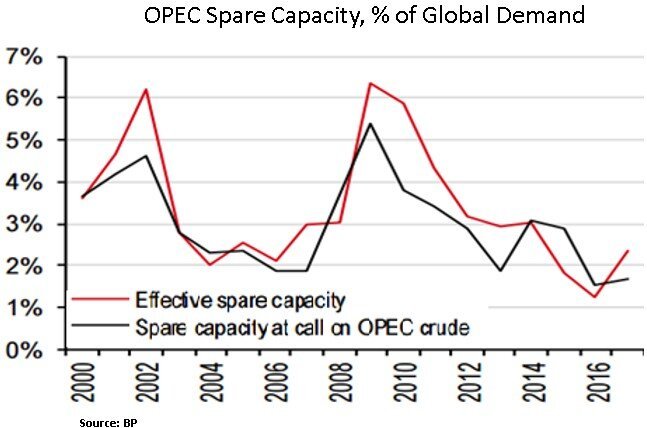
In the medium-term, the energy market is contributing to restrained global inflation via high oil inventories. A 9 month OPEC supply cut extension has engineered a backwardation in the oil futures market (i.e. near-term contract prices are higher than long dated contracts). A backwarded curve incentivizes the liquidation of inventory by making it uneconomic to carry. This benefits the Saudis as they get better export prices vs. non-OPEC members such as U.S. shale producers that are forced to sell their oil output at lower long-dated futures prices. The basic OPEC goal is to rebalance the global inventory outlook by 2018. From then on, a lack of investment in long-cycle conventional oil wells is likely to lead to progressively higher oil prices; to satisfy a projected oil deficit by 2019-2020. Without major reserve discoveries, OPEC spare capacity appears to be diminishing and more expensive break-even prices for U.S. shale/tight oil producers are likely to contribute to a long-term recovery in energy prices. Lack of new short-cycle U.S. shale discoveries and high shale reservoir decline rates are likely to lead to exploration activities to higher cost/long-cycle conventional projects (particularly as global non-OPEC conventional fields continue to mature). Therefore, the Fed is better off normalizing its balance sheet while today’s low energy prices keep inflation in check.

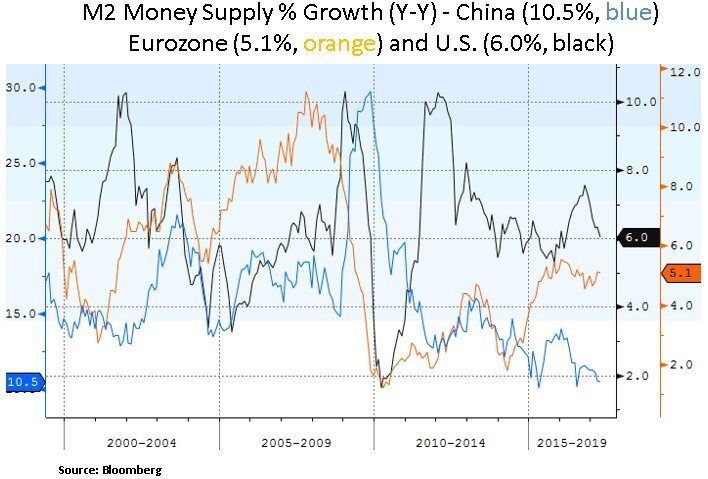
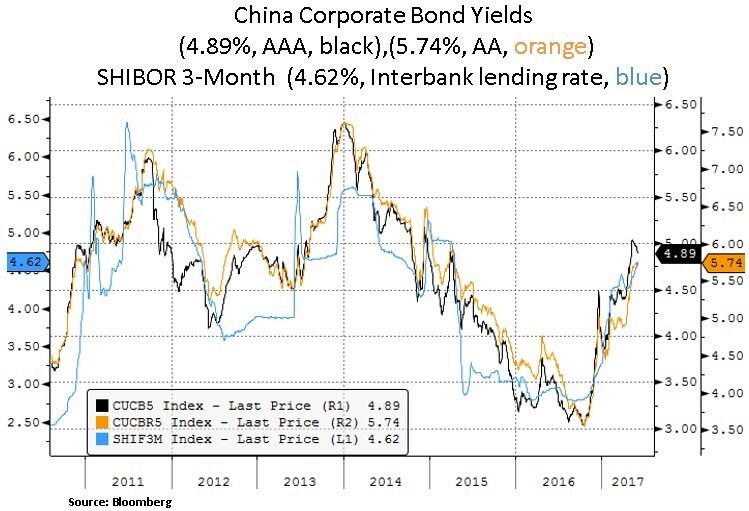
Lastly, we highlight below the recent pick-up in Chinese corporate borrowing costs. In our view, the true epicenter of global reflation expectations is still China; as the country dominates global credit creation. China has been successful in stemming off capital outflows but regulators have shifted their attention to shadow banking financing. Any credit related hiccup in China is likely to provide a better entry point to global cyclical equities e.g. industrials and materials.
In conclusion, investors are currently facing a backdrop of elevated asset prices and subdued cross-asset volatility. From our perspective, we continue to selectively allocate capital in income generating instruments and in equity themes that offer sustainable earnings and dividend growth. We retain our preference for industry leaders in technology, healthcare and selective global industrials & energy names. A mean-reversion in volatility and/or any policy missteps would likely open better entry points in both the equity and fixed income spectrums.
Christos Charalambous CFA
Senior Strategist
christos.charalambous@edgewealth.com
Please remember that past performance may not be indicative of future results. Different types of investments involve varying degrees of risk, and there can be no assurance that the future performance of any specific investment, investment strategy, or product made reference to directly or indirectly in this newsletter (article), will be profitable, equal any corresponding indicated historical performance level(s), or be suitable for your portfolio. Due to various factors, including changing market conditions, the content may no longer be reflective of current opinions or positions. Moreover, you should not assume that any discussion or information contained in this newsletter (article) serves as the receipt of, or as a substitute for, personalized investment advice from Edge Wealth Management, LLC. To the extent that a reader has any questions regarding the applicability of any specific issue discussed above to his/her individual situation, he/she is encouraged to consult with the professional advisor of his/her choosing. A copy of our current written disclosure statement discussing our advisory services and fees is available for review upon request.