Diverging Fed-ECB policy paths
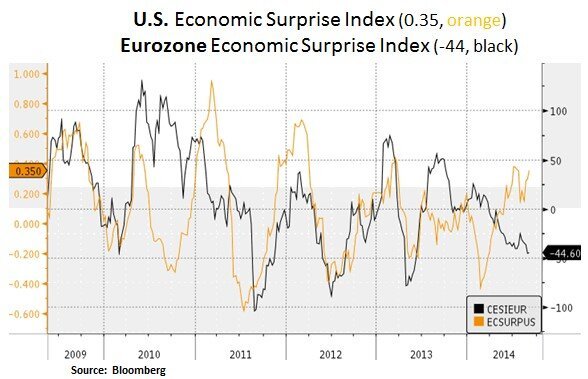
Financial market participants are witnessing a widening divergence between U.S. and European economic fundamentals. As such, the Fed and the ECB find themselves at different milestones in their monetary policies. After nearly six years of zero nominal interest rates and a quintupling of its balance sheet to $4.4 trillion, the Fed is now attempting to exit its ultra-easy policy. This effort should be seen in the context of a recovering labor market (now at 6.2% unemployment rate) and a household net worth level that exceeds the 2007 highs i.e. $82 trillion vs. $68 trillion. In contrast, the ECB has not been as aggressive in its monetary easing stance. Market expectations are once again rising with regard to more impactful easing measures i.e. in the form of public and private asset purchases. From our perspective, the broader U.S. fixed income space is already pricing in a low growth/inflation and tight corporate credit spread backdrop. We continue to prefer the non-agency MBS space as a good source of income generation with low duration. In U.S. equities, with indices at all-time highs (e.g. S&P 500 at 2003) we remain highly selective with a preference for value opportunities in sectors that offer visible earnings growth e.g. technology and healthcare. We are interested in businesses that offer innovation, long product cycles, strong competitive advantages and defensible profit margins.
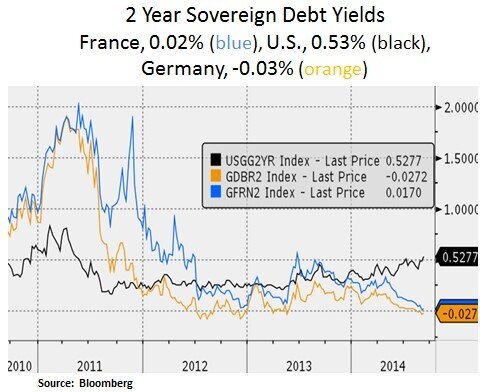
As we can see below, the short-term sovereign debt markets are pricing the fundamental and policy divergences for the U.S. and the Eurozone. In U.S. Treasuries, we expect gradual pressure at the front end of the curve. In Europe, after an elongated cycle of bank deleveraging, we are hopeful that record low borrowing costs and a decisive ECB response may finally unclog the necessary credit transmission channels; especially for south European economies and small/mid-size businesses.


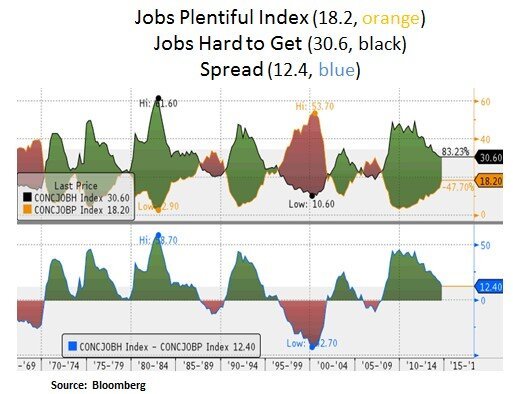
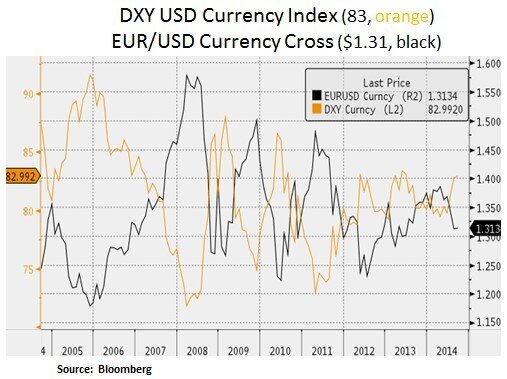
In the U.S., the labor market is showing signs of gradual tightening. At the corporate level, we expect CEOs to shift their focus from share buybacks to capital and labor investments; as a mid to late cycle attempt to grow sales and earnings. Such a pick-up in enterprise spending is likely to benefit technology companies (e.g. business analytics and software) and late-cycle industrial names (e.g. power and energy infrastructure). Hence, we are currently observing a jump in job openings as demand for skilled labor increases. If we look at unemployment rates by education level, it is evident that high skilled labor unemployment is already at an advanced cyclical recovery. In our view, demand is likely to exceed supply of skilled labor and as a result wage inflation may increase faster than currently expected. As such, the Fed may bring forward its interest rate hike timetable. The market is currently expecting the first interest rate increase in Q2 of 2015. Such a scenario, along with ECB action, may put further upward pressure on the USD vs. the Euro. A weaker Euro will likely arrest deflationary pressures in the Eurozone via increased import prices.
Lastly, if labor demand outstrips supply for skilled labor, small businesses will likely be more vulnerable to rising labor costs. Thus, on the equity front, our general preference is towards large-cap equities that have superior scale and a better ability to absorb an increase in labor input costs. The secular trend for automation and increased use of robotics is likely to put U.S. large-cap entities at a competitive advantage vs. smaller and international competitors. Therefore, the current profit cycle for large-cap entities may be more insulated from wage inflation pressures.


Christos Charalambous CFA
Senior Strategist
christos.charalambous@edgewealth.com
Please remember that past performance may not be indicative of future results. Different types of investments involve varying degrees of risk, and there can be no assurance that the future performance of any specific investment, investment strategy, or product made reference to directly or indirectly in this newsletter (article), will be profitable, equal any corresponding indicated historical performance level(s, or be suitable for your portfolio. Due to various factors, including changing market conditions, the content may no longer be reflective of current opinions or positions. Moreover, you should not assume that any discussion or information contained in this newsletter (article) serves as the receipt of, or as a substitute for, personalized investment advice from Edge Wealth Management, LLC. To the extent that a reader has any questions regarding the applicability of any specific issue discussed above to his/her individual situation, he/she is encouraged to consult with the professional advisor of his/her choosing. A copy of our current written disclosure statement discussing our advisory services and fees is available for review upon request.