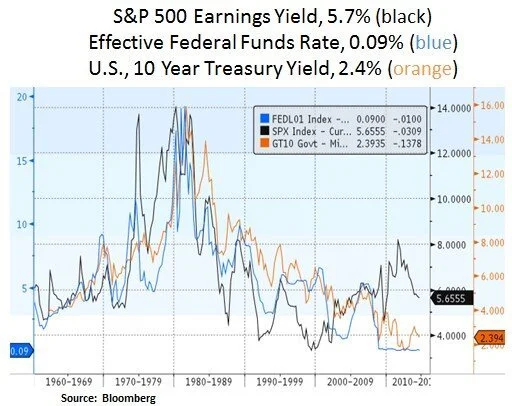
Low Sovereign Debt Yield Backdrop Endures
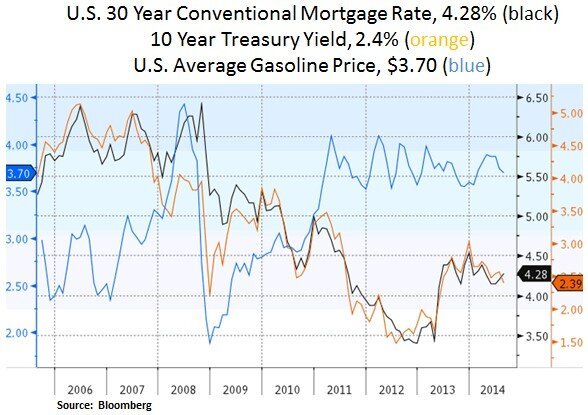
Financial market participants are witnessing a backdrop that features low global GDP growth (2.8% 2014) and deflationary undertones. The latter is largely attributed to flat Q2 GDP growth in the Eurozone and lower energy prices. Brent and WTI crude oil prices are off 9% from their recent 2014 highs to $102 and $96 respectively. The crude oil market is currently well supplied and the recent U.S. military intervention in Iraq has eased supply disruption concerns. The above factors and elevated demand for high grade collateral, have led to fresh lows for developed market sovereign debt yields; particularly for German Bunds as the German economy contracted in Q2 by 0.2% (Q-Q) or 0.8% (annualized). Geopolitical issues and Russian sanctions have weighed on German exports and business sentiment. On a more positive note however, U.S. equities have shrugged off recent geopolitical headwinds (S&P 500 +8.5% Year-to-Date, NASDAQ +9.1% and Dow Jones +3.5%).
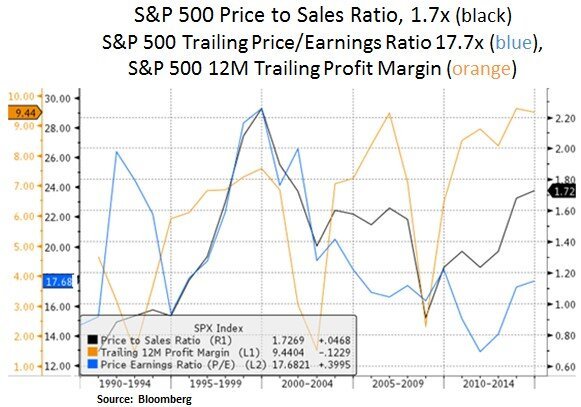
In our view, the suppressed interest rate environment has amplified demand for yield; especially from sovereign wealth funds and pension funds. At the same time, the U.S. corporate sector has been a dominant buyer of U.S. equities, with share buybacks in excess of $0.5 trillion in the past 3 years. Fundamentally, U.S. equities have benefited from a cyclical recovery in profit margins. Historically low labor costs and low effective tax rates (as international sales increase) have contributed to record corporate profitability. At this juncture we view U.S. equities as fairly valued. Our focus remains on individual stock selection and capital allocation at the sector level i.e. in industries that offer favorable risk-reward investment profiles.


As we argued in recent articles, we are more constructive on the state of U.S. household and corporate balance sheets. Financial conditions are not tight enough to derail the current business cycle. The non-financial corporate sector has effectively added financial leverage on its balance sheet (56% debt/GDP vs. 52% in 2007). Yet, corporations have also pushed out debt maturities towards the end of the decade. As the labor market continues its recovery and wages gradually increase, we should see interest rate hikes by the Fed in 2015. The question is to what extent and over what timeframe. The key debate going forward is how the Fed will manage its exit strategy and how will global asset prices adjust as the Fed attempts to cautiously normalize its policy. At the global level, expectations are on the rise for further central bank easing measures; especially in Europe and to a lesser degree in China. Therefore, as these policy dynamics play out, we remain opportunistic in capturing value opportunities across asset classes.
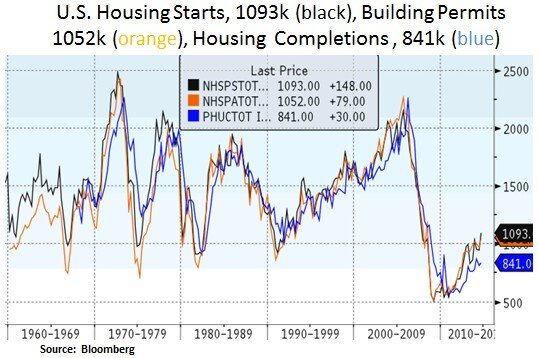
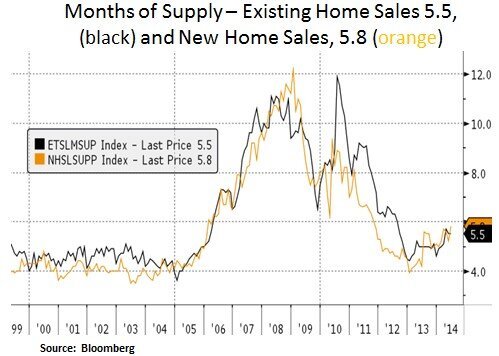
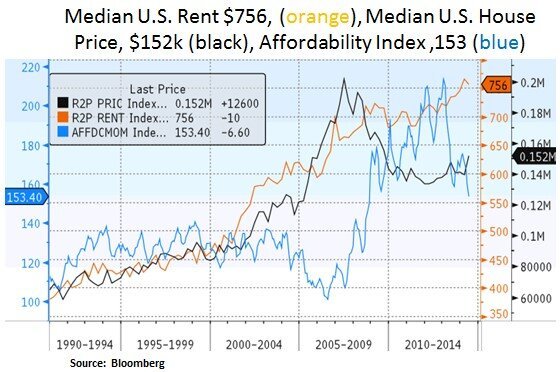
Lastly, we remain optimistic with regard to the ongoing U.S. housing recovery. As we can see below, housing activity is still at multi-decade lows. Inventories are well managed by homebuilders. Moreover, declining vacancy rates indicate healthy housing demand ahead. Increased supply of housing units will likely ease some of the affordability issues that first-time buyers and renters are facing. As a result, we are hopeful that the consumer-driven U.S. GDP growth will benefit.


Christos Charalambous CFA
Senior Strategist
christos.charalambous@edgewealth.com
Please remember that past performance may not be indicative of future results. Different types of investments involve varying degrees of risk, and there can be no assurance that the future performance of any specific investment, investment strategy, or product made reference to directly or indirectly in this newsletter (article), will be profitable, equal any corresponding indicated historical performance level(s, or be suitable for your portfolio. Due to various factors, including changing market conditions, the content may no longer be reflective of current opinions or positions. Moreover, you should not assume that any discussion or information contained in this newsletter (article) serves as the receipt of, or as a substitute for, personalized investment advice from Edge Wealth Management, LLC. To the extent that a reader has any questions regarding the applicability of any specific issue discussed above to his/her individual situation, he/she is encouraged to consult with the professional advisor of his/her choosing. A copy of our current written disclosure statement discussing our advisory services and fees is available for review upon request.