Federal Reserve approaching another policy pivot point
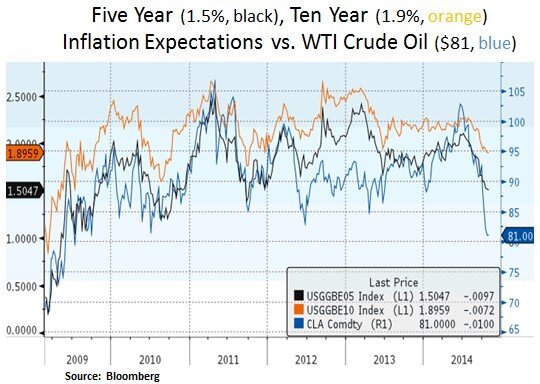
Financial market volatility subsided from its recent high on Oct 15th. The CBOE implied volatility index (VIX) for S&P 500 options declined from its intraday high of 30.9 on Oct 15th to 15.43 (Oct 28th). The S&P 500 equity index rebounded from an intraday 1820 level to 1985. Moreover, the 10 Year Treasury yield rebounded from its Oct 15th intraday low of 1.86% to 2.28%. Yet, crude oil prices have remained near their recent low levels e.g. WTI and Brent crude oil at $81 and $86 respectively. Market participants expect the Federal Reserve to conclude its current quantitative easing program by this week’s two-day FOMC meeting (28-29th). The market is expecting the first interest rate hike by the second or third quarter of 2015. In our view, there is currently a delicate and uneven balance between global growth and inflation expectations. In this context, global Centrals Banks are likely to lean on the side of caution with regard to tightening prematurely. Therefore, along with low commodity/energy costs, ‘lower for longer’ financing costs may facilitate the next leg for the current business cycle. From our portfolio perspective, we continue to focus on income generation, value opportunities and positioning in industries and securities that offer more visible cash flow generation.
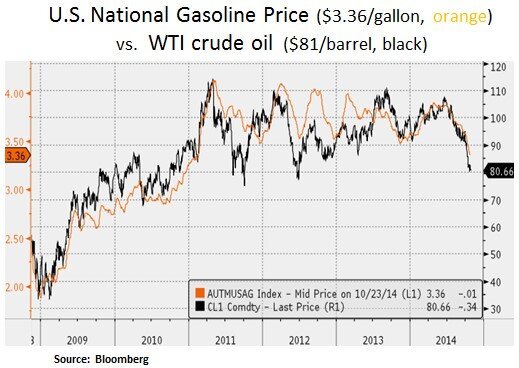
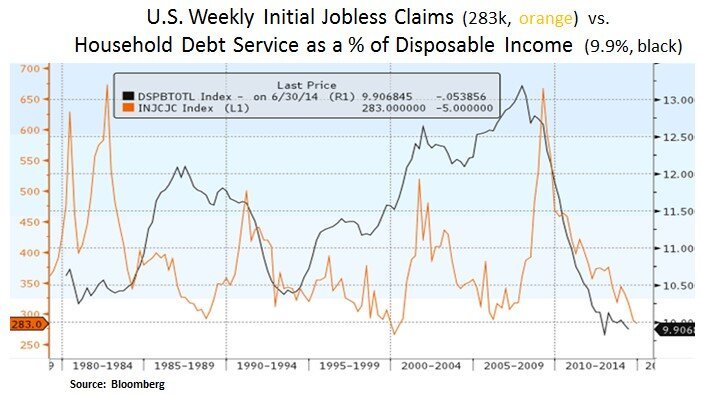
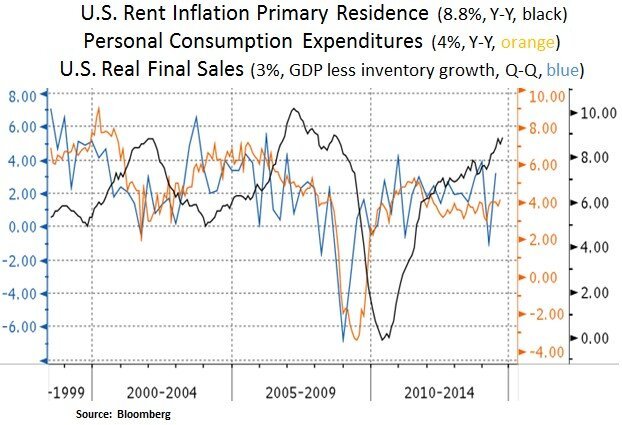
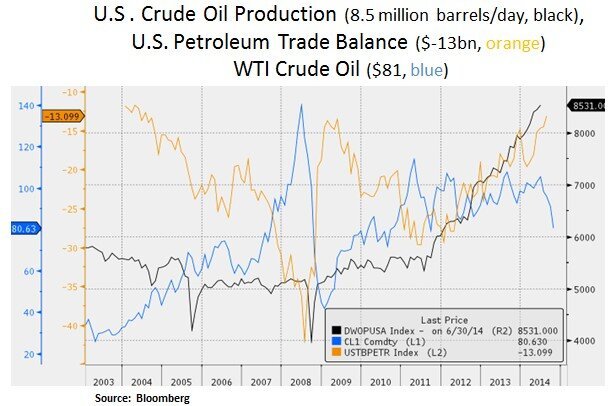
Market debate has been heating up with regard to the costs and benefits of the recent decline in oil prices. In our view, in a consumer driven economy (71% of U.S. GDP), the U.S. consumer is likely to benefit from the decline in gasoline prices and also from the subdued interest/mortgage rate backdrop. This is occurring at a time whereby rent inflation has been on the rise due to a low rental vacancy rate. On the other hand, oil prices need to stay above the shale/tight oil marginal cost of production (~$70-75) in order to sustain the U.S. energy sector’s material contribution to the U.S. economy i.e. via capital expenditures and via the labor market.
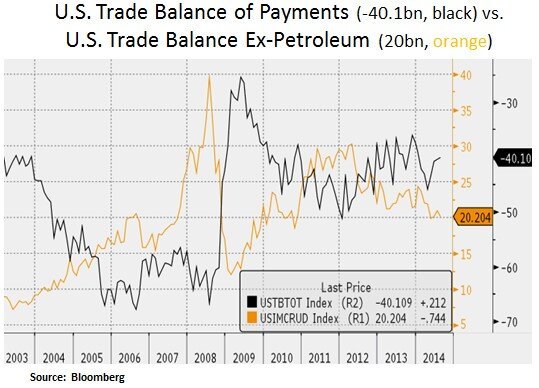
U.S. crude oil production has recently hit levels last seen in the mid-1980s. The U.S. shale/tight oil renaissance has contributed to a reduction to the U.S. energy deficit and trade balance. In fact, excluding petroleum products, the U.S. trade balance of payments has deteriorated i.e. from a positive balance of $30bn in early 2012 to a recent Q2 2014 low of $20bn. From an investment point of view, we favor exposure to energy pipeline and mid-stream energy infrastructure MLPs. The recent elevated inventories of WTI crude oil are partly due to ongoing demand for pipelines. Hence, as we discussed in our last article, we took advantage of the mid-October dislocation in the energy sector and added to our exposure to this high growth and high dividend yielding industry.
From a global perspective, industry estimates point to a ~$700 billion reduction in global spending for oil consumption. Essentially, this amounts to a re-distribution from oil exporters to importers. Lower oil prices serve as an economic stimulus for the vast majority of the world’s countries. As we can see below, this benefits energy challenged countries such as Japan, key Eurozone countries (France, Germany, Italy) and key emerging markets such as India and China. Therefore, we are hopeful that lower energy prices can give a positive jolt to the global growth outlook, especially as we look ahead into 2015.
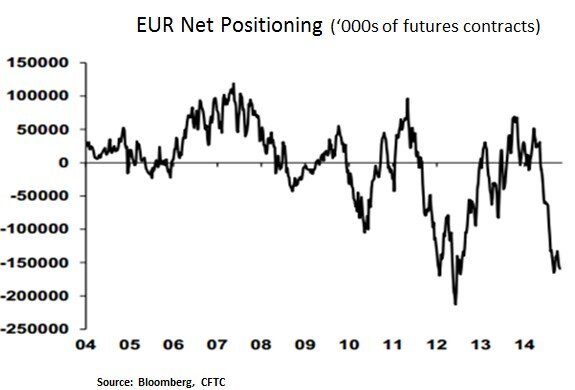
Lastly, we point to the financial markets’ recent positioning in the crude oil and currency markets. In our view, part of the reason for the mid-October pick-up in volatility was due to a major positioning shift in crude oil and the EUR/USD currency cross. Therefore, it is plausible that market risk positioning (especially by hedge funds) is currently better balanced.


Christos Charalambous CFA
Senior Strategist
christos.charalambous@edgewealth.com
Please remember that past performance may not be indicative of future results. Different types of investments involve varying degrees of risk, and there can be no assurance that the future performance of any specific investment, investment strategy, or product made reference to directly or indirectly in this newsletter (article), will be profitable, equal any corresponding indicated historical performance level(s, or be suitable for your portfolio. Due to various factors, including changing market conditions, the content may no longer be reflective of current opinions or positions. Moreover, you should not assume that any discussion or information contained in this newsletter (article) serves as the receipt of, or as a substitute for, personalized investment advice from Edge Wealth Management, LLC. To the extent that a reader has any questions regarding the applicability of any specific issue discussed above to his/her individual situation, he/she is encouraged to consult with the professional advisor of his/her choosing. A copy of our current written disclosure statement discussing our advisory services and fees is available for review upon request.