Global Yield Bottoming Process Underway
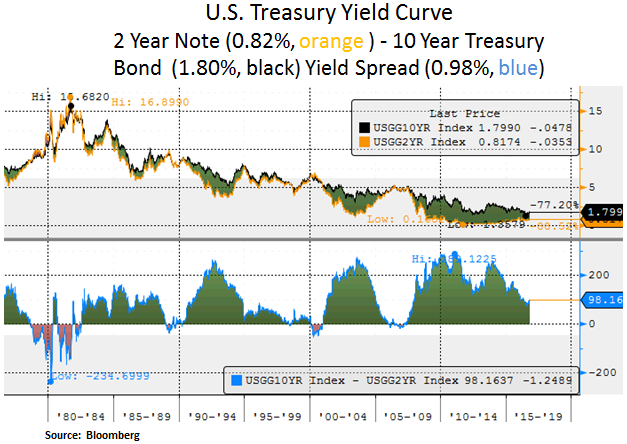
Investor focus has been centered on the outcome of the U.S. elections and the global yield curve steepening driven by rising long-term rates. Part of the bear steepening is explained by the shifting Central Bank focus to facilitate better bank profitability prospects. Recovering inflation metrics, driven by energy prices and labor costs, also support the ungluing of global bond yields from rather distorted levels. Negative yielding global debt has declined from $12.2 to $9.8 trillion since peak levels in June. In the past month, the 10 Year Treasury and German bund yields rose by 0.20% and 0.25% respectively (to 1.80% and 0.12%). Domestic turmoil also drove 10 Year U.K. Gilts and Italian BOTs by 0.44% and 0.48% higher. Italy is facing an important constitutional referendum on Dec 4th. A ‘No’ vote could lead to political turmoil with a likely resignation of the prime minister and a potential rise of anti-euro political parties. Further weakness in the Euro could create another USD headwind for U.S. multinationals. On the U.S. election front, the prospect of a tighter race has led to increased near-term volatility in U.S. equity markets. The total return (year to date) for U.S. equities is as follows: S&P 500 +5.2%, DOW JONES +5.8% and NASDAQ +4.0%. We look to deploy more capital as global bond yield re-pricing, further USD strength or political jitters create attractive entry points.
On a more sanguine tone, we note below that despite the rise in U.S. Treasury yields, rate volatility measures remain in check. In addition, inflation adjusted or TIPS implied real interest rates remain range bound in a fairly low range. As we are at an advanced stage in the business, credit and asset market cycles, we do not foresee material advances in U.S. Treasury yields. Most likely, European sovereign bond yields carry more risk as they are still at very low levels. It is also plausible that global capital rotates from negative yielding Japanese and European bonds to U.S. Treasuries.


On the U.S. and global inflation front, we note that both consumer and producer prices have been firming up. From a U.S. perspective, rebounding energy prices, wage growth, healthcare and rent inflation are lifting consumer prices. Goods, services and food inflation remains low however. Inventory growth is lifting U.S. Q3 GDP growth, with real final sales (i.e. real end demand) at 2.3% (annualized basis). Such economic and inflation data have boosted the market’s expectation for a December interest rate hike by the Fed. Market implied odds currently stand at 78%. From an U.S. equity perspective, we remain underweight in still relatively expensive sectors such as consumer staples and utilities. As global bond yields bottom out, we seek better entry points in such interest rate sensitive sectors.
In our view, the biggest roadblock to a meaningful Fed interest rate hiking cycle is the U.S. dollar. Weakness in key currencies such as the Euro, the Yen and even the British pound leave the U.S. dollar as the dominant global reserve currency. Further U.S. dollar strength could pressure dollar denominated energy prices such as oil; which in turn would undermine the recovery in global capital expenditures. Moreover, emerging market debt markets could also be impacted as USD funding costs rise. Thus, we would look for investment opportunities in internationally exposed equities (e.g. tech, industrials, energy, healthcare) in the event that Fed induced rate hikes cause further USD headwinds for U.S. corporations. Ironically, USD strength acts as a global deflationary force, which would undermine the Fed’s goals for price stability and a ~2% inflation target. Finally, we point out that easy Chinese credit and successive fiscal stimulus may not be sustained into 2017. There is a concern for an overheating Chinese property market. Housing prices in China’s major cities are up by ~30% on a year ago and Chinese household leverage is at a record high. The ratio of house prices to household disposable income in tier-1 cities was 15x at the end of 2015; and it’s now around 18-20x. Looking into 2017, we would avoid base metal exposure such as iron ore and related miners exposed to China.
Lastly, at the U.S. equity sector level, we note that the healthcare sector has been pressured by U.S. election related headline risk. Whereas pricing concerns may linger, we note that relative valuation metrics are supportive vs. the S&P 500. Both on a price/sales ratio and on a free cash flow yield basis, healthcare relative valuation is at levels last seen in early 2011. Over the long-run, aging global demographics, demand by emerging market consumers and productive drug pipelines are pillars of fundamental support. We also highlight the technology sector’s recent outperformance. We remain overweight in the U.S. tech sector as it still features respectable organic growth and ample balance sheet capacity for capital returns.


In conclusion, we remain opportunistic as the global bond yield backdrop re-prices and as political volatility in the U.S. and the EU creates uncertainty episodes. Our focus remains on income generating instruments and large-cap equities that have strong competitive advantages, favorable organic growth prospects and robust balance sheets.
Christos Charalambous CFA
Senior Strategist
christos.charalambous@edgewealth.com
Please remember that past performance may not be indicative of future results. Different types of investments involve varying degrees of risk, and there can be no assurance that the future performance of any specific investment, investment strategy, or product made reference to directly or indirectly in this newsletter (article), will be profitable, equal any corresponding indicated historical performance level(s, or be suitable for your portfolio. Due to various factors, including changing market conditions, the content may no longer be reflective of current opinions or positions. Moreover, you should not assume that any discussion or information contained in this newsletter (article) serves as the receipt of, or as a substitute for, personalized investment advice from Edge Wealth Management, LLC. To the extent that a reader has any questions regarding the applicability of any specific issue discussed above to his/her individual situation, he/she is encouraged to consult with the professional advisor of his/her choosing. A copy of our current written disclosure statement discussing our advisory services and fees is available for review upon request.