Subtle global pivot towards fiscal policy
Market focus has been dominated in the past seven years by unprecedented monetary policy easing. After hundreds of global interest rate cuts and a material expansion of their balance sheets (+$15 trillion), Central Banks have now become increasingly aware of the adverse impact of low bond yields on financial sector profitability. Thus, Central Banks such as the Bank of Japan (BoJ) are now looking for a steeper yield curve to support banks. Such an endeavor would likely require some unwinding of long duration asset purchases. The 10 Year U.S. Treasury yield is currently at 1.65% vs. -0.08% for both the 10 Year German Bund and the Japanese Government Bond (JGB). For the latter two bond markets, deflationary concerns still linger. We doubt the Fed would engage in active selling of their long-term bond portfolio as that would increase global bond volatility. In addition, at the short end of the curve, cyclical wage pressures will likely keep the Fed’s impulse to gradually raise overnight rates. Therefore, active steepening of the yield curve by the Fed carries risks. Fundamentally, recovering oil prices along with a recovery in global capital expenditures will likely help the yield curve to steepen modestly. Moreover, after years of fiscal austerity, there is some scope for global fiscal packages; which could also help the bottoming of global government bond yields.
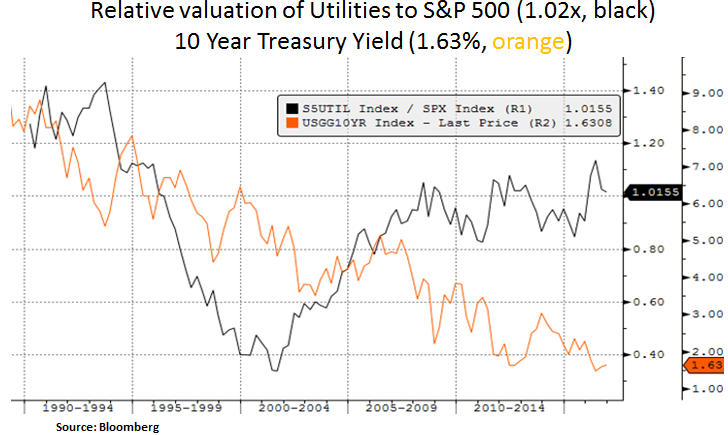
From our perspective, we remain opportunistic in the event U.S. Treasury yields trickle up on post-election fiscal stimulus action. We are currently underweight relatively expensive rate sensitive equity sectors such as consumer staples and utilities. We highlight below the ratio of the Fed’s core PCE (personal consumption expenditure) inflation metric vs. the 10 year yield (black line). Firming inflation will likely keep the Fed on its gradual policy normalization path. We also note below the recent retracing of the valuation premium of the Utilities sector vs. the S&P 500 (black line). We continue to look for better entry points in the utilities sector and other interest rate sensitive assets such as REITs.


Government spending growth has been very low in this cycle by historical standards. Both Trump and Clinton have emphasized fiscal stimulus. The candidates’ ability to implement their plans if elected may be limited by a number of factors, including congressional gridlock. Realistically, a modest fiscal stimulus can be expected (<1% of GDP) and hence a modest steepening of the Treasury yield curve. In the medium-term, if fiscal stimulus leads to increased growth, the market may re-price to a degree the path of policy rates. Yet, in our view, the curve is liable to flatten again after such a fiscal scenario, as structural factors weigh e.g. low productivity and aging demographics. Moreover, elevated pension liabilities are likely to keep firm demand for long duration assets.
In spite of very low interest rates, U.S. households and businesses remain net savers; 4.1% and 1.6% net saving (as a % of GDP) respectively. Net saving by these groups has undermined the effectiveness of monetary policy. Therefore, there is some scope for the federal and local government to act as a lender of last resort by administering fiscal stimulus. As we can see below, across key regions, public fixed investment has been underwhelming due to fiscal austerity measures. To be sure, elevated public debt levels are a constraint but low debt service levels allow for some fiscal leeway. Our portfolio positioning in the industrials and energy sectors has been benefiting from expectations for a global shift towards fiscal accommodation.
Lastly, we note below the close relationship between S&P 500 near-term volatility (VIX) and corporate credit spreads. Credit market stability and corporate profitability are important for the final leg in the current business and asset cycles. Fiscal spending could alleviate some of the near-term profit headwinds U.S. companies have been incurring i.e. due to the oil sector downturn, low private sector spending and rising wage pressures. On a technical note, low capacity utilization (75%, black line) does not indicate big demand for infrastructure. Typically the sweet spot for capital expenditures is when capacity constraints limit production increases. Hence, as discussed earlier, we have measured expectations for the likely impact of the shift towards fiscal accommodation.


In conclusion, as Central Bank policies are currently extended, market expectations have been gradually shifting to fiscal accommodation policy measures. For U.S. equities, this view has contributed to a sector rotation away from expensive interest sensitive sectors (such as utilities and consumer staples) and into cyclical sectors such as energy and industrials. We look to be nimble as a potential trickling up in Treasury yields creates buying opportunities in interest rate sensitive assets. We note that our core MBS exposure features relatively low interest rate sensitivity.
Christos Charalambous CFA
Senior Strategist
christos.charalambous@edgewealth.com
Please remember that past performance may not be indicative of future results. Different types of investments involve varying degrees of risk, and there can be no assurance that the future performance of any specific investment, investment strategy, or product made reference to directly or indirectly in this newsletter (article), will be profitable, equal any corresponding indicated historical performance level(s, or be suitable for your portfolio. Due to various factors, including changing market conditions, the content may no longer be reflective of current opinions or positions. Moreover, you should not assume that any discussion or information contained in this newsletter (article) serves as the receipt of, or as a substitute for, personalized investment advice from Edge Wealth Management, LLC. To the extent that a reader has any questions regarding the applicability of any specific issue discussed above to his/her individual situation, he/she is encouraged to consult with the professional advisor of his/her choosing. A copy of our current written disclosure statement discussing our advisory services and fees is available for review upon request.