U.S. Corporate Profit Cycle Facing Increasing Headwinds
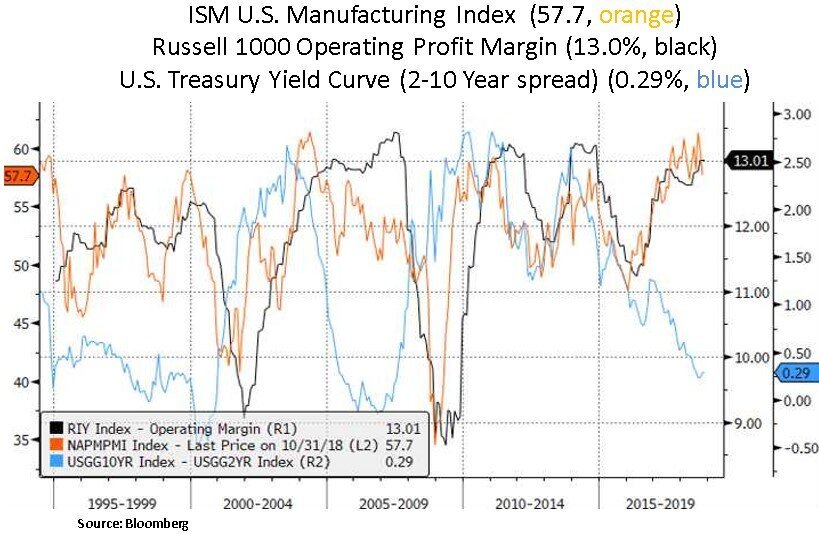
October was a month that witnessed higher volatility in the U.S. equity market, with the S&P 500 index declining by 11.5% (from Oct. 3rd to an intra-day low on Oct. 29th). Moreover, the NASDAQ and DOW Jones indices saw 14% and 10% declines respectively. Over the same timeframe, the 10 Year Treasury bond yield declined by 0.20% to 3.06%. After a recent Nov. equity rebound however, on a year-to-date (YTD) basis, index total returns are as follows: S&P 500 +4.5%, NASDAQ +7.3% and DOW +5.3%. We note that 46% of the S&P 500 index has negative performance and 25% is off more than 10%. The Barclays US Aggregate Bond Index (AGG) is off 2.5% YTD. Such volatility is not uncommon late in the business cycle, and particularly when combined with rising interest rates and increased uncertainty about global growth prospects. Key fundamental headwinds at this juncture of the U.S. corporate profit cycle include 2019 margin risk and tighter financial conditions. Fiscal restraint by companies will likely impact the pace of share buybacks in 2019. The recent Q3 2018 earnings season pointed to early evidence of the 2019 margin pressure i.e. rising input costs, a tight labor market and rising interest rates. Corporations plan to pass along costs and tariff pressures as they are incurred via higher pricing. Passing along higher input costs is likely to be more difficult than expected. In our view, consensus estimates need to adjust for rising cost pressures. We also note renewed weakness in business investment in the Q3 U.S. GDP report; the latter was boosted by inventory rebuild.
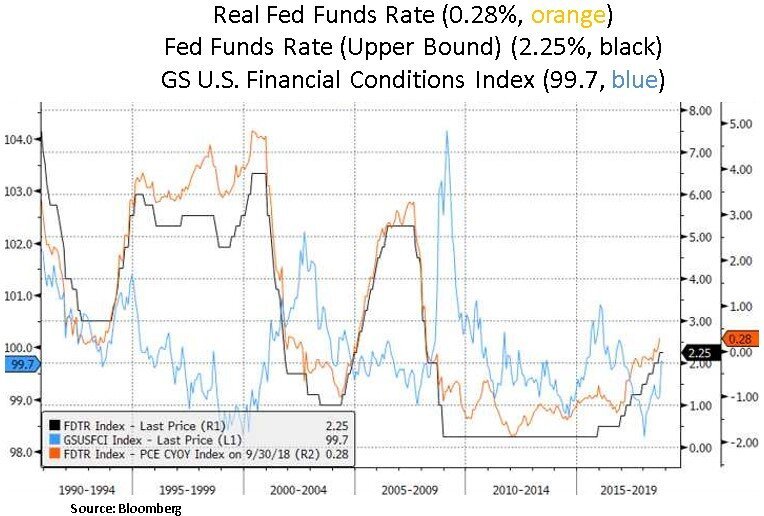
A further headwind as 2019 draws near is the G7 Central Bank aggregate balance sheet contraction that is likely to accelerate as cyclical inflation matures. As such, we remain focused on the declining liquidity from the Fed’s ongoing balance sheet reduction and the ECB’s tapering of its QE program that began last month. Even though financial conditions are not that tight yet, we see an increasing risk for a Fed policy mistake as policy normalization is entering its critical phase. The Fed is now absorbing $50bn in excess reserves every month. Further volatility in long-term interest rates would probably prompt the Fed to delay additional rate hikes.

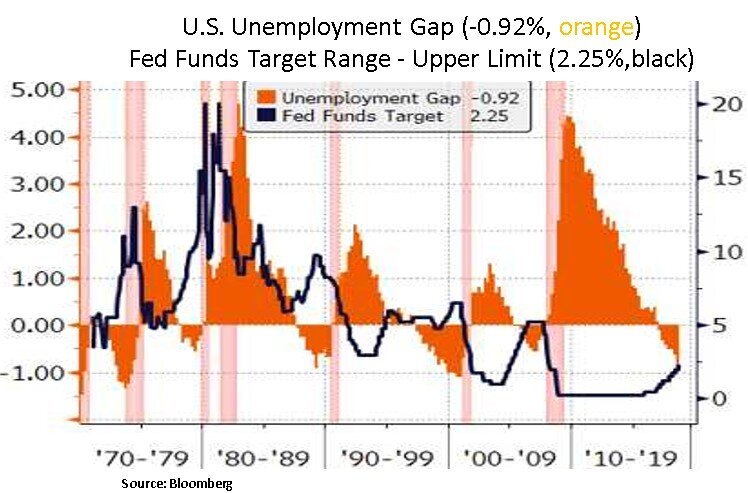
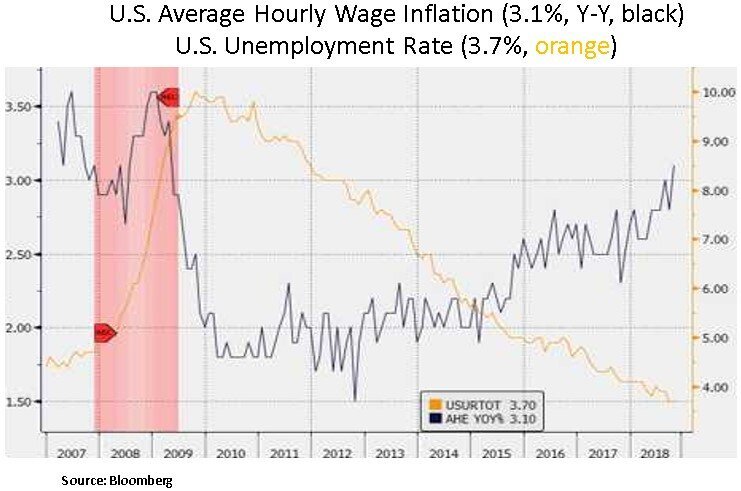
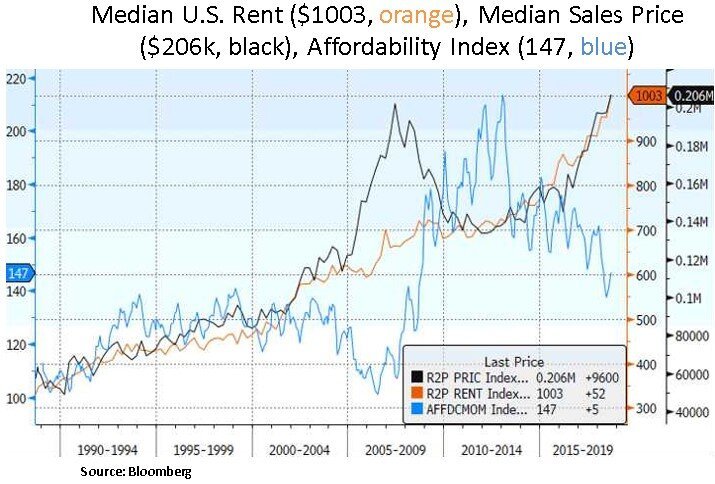
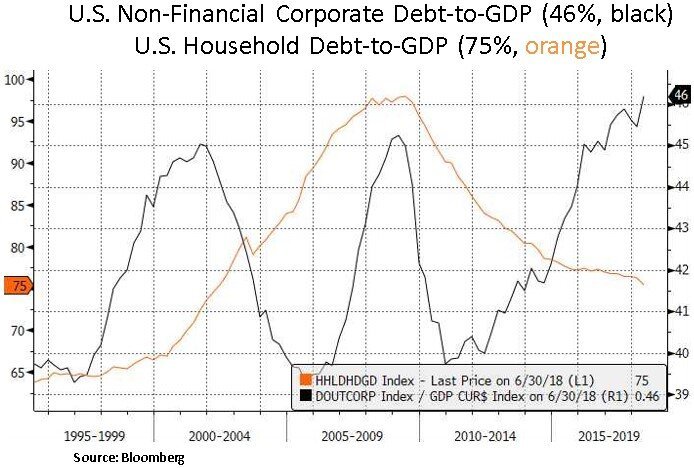
The Fed will likely continue tightening until economic data start decelerating and until asset prices start causing a negative wealth effect. To some degree the Fed is boxed in. The U.S. labor market is very tight and wage inflation is accelerating. The most recent non-farm payroll report indicated an annualized wage inflation rate of 3.1%. Job openings are at record highs (7 million job openings) and an increasing number of firms are indicating difficulty in filling job openings - most likely due to an insufficient supply of skilled labor. We also highlight below the decreasing unemployment gap, which in prior cycles preceded recessionary periods. Other inflation metrics such as median rents and home prices are also at all-time highs. Along with historically high home prices, the recent increase in mortgage rates has further reduced home affordability. The Fed also sees a corporate leverage cycle that is beyond prior cycle highs i.e. non-financial corporate debt to GDP at 46%. As such, the Fed doesn’t want to fall behind the curve in dealing with cyclical inflation and excess credit creation. However, with a lag, the Fed’s actions will have a deflationary impact eventually. Thus far in 2018, we have seen the consequences of monetary tightening on a global basis with non-U.S. regions underperforming U.S. equities; along with a paring back of risk exposures e.g. in Emerging Markets and Europe (that is more emerging market exposed in terms of sales).
From our portfolio perspective, in the recent volatility episode, we avoided a lot of the falling knives in overvalued segments of the U.S. equity market and in sectors that are very sensitive to cyclical growth/margin risk e.g. chemicals, industrials, homebuilders, small caps and risky energy sector names. We continue to focus on selective large-cap equities that have more resilient demand (e.g. healthcare, consumer staples, telecoms) and secular growth potential (e.g. cloud computing, big data analytics, artificial intelligence) and other defensive/micro driven equities with sustainable cash flows and dividends. As corporate credit spreads have recently started to widen, we are mindful to avoid highly indebted companies with questionable earnings profiles.
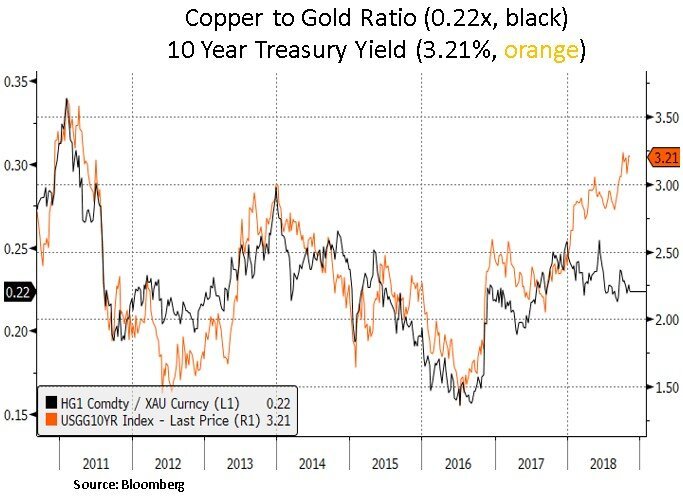
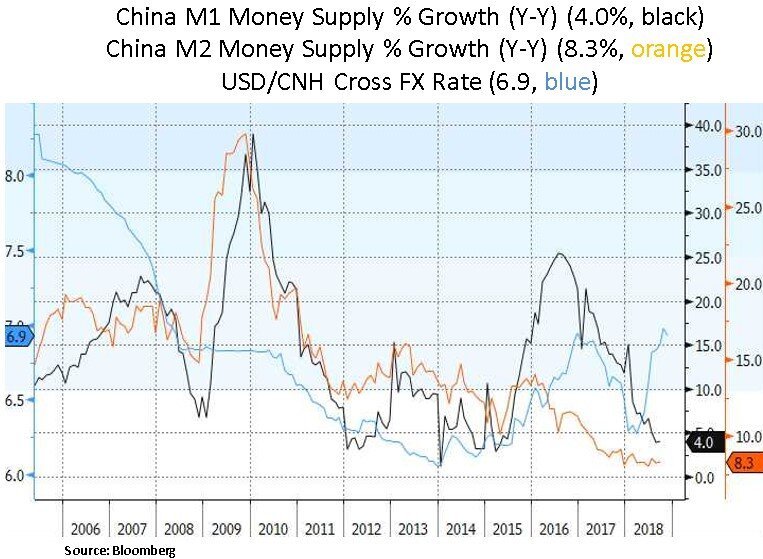
Lastly, we highlight below the divergence between the copper/gold ratio and the 10 Year Treasury yield. The first metric likely contradicts the long-term inflation expectations priced by long-term Treasury bonds. Weakness in base metals like copper would typically indicate a global growth deceleration; with one of the key global growth engines (China) facing growth headwinds. Beyond the trade frictions with the U.S. and the potential for further U.S. tariffs in January, the main issue in China has been credit deleveraging, whereby policy makers have been attempting to rein in excess credit creation e.g. the Chinese shadow banking system. The question is whether the Fed can continue tightening and shrinking its balance sheet at the same pace in 2019 as global growth is decelerating. In addition, the Fed is going to face an increasing supply of bonds by the U.S. Treasury to fund our widening budget deficits. From our portfolio perspective, further upward pressure on Treasury yields will likely create more asset volatility but also an opportunity to deploy additional capital in interest sensitive assets. At some point, the Fed will likely be forced to reverse course if financial conditions deteriorate materially; particularly as the corporate profit cycle peaks. Thus, a deflationary period will likely be bullish for Treasuries and interest sensitive instruments.
In conclusion, we are navigating a backdrop of increasing corporate margin pressures and challenged global liquidity conditions. In our view, a flattening Treasury yield curve and gradually widening corporate credit spreads are a harbinger of a decelerating corporate profit outlook. Thus, we aim to be more opportunistic capital allocators across both equity and fixed income spectrums, as further volatility episodes or policy shifts take place in 2019 and beyond.
Christos Charalambous CFA
Senior Strategist
christos.charalambous@edgewealth.com
Please remember that past performance may not be indicative of future results. Different types of investments involve varying degrees of risk, and there can be no assurance that the future performance of any specific investment, investment strategy, or product made reference to directly or indirectly in this newsletter (article), will be profitable, equal any corresponding indicated historical performance level(s), or be suitable for your portfolio. Due to various factors, including changing market conditions, the content may no longer be reflective of current opinions or positions. Moreover, you should not assume that any discussion or information contained in this newsletter (article) serves as the receipt of, or as a substitute for, personalized investment advice from Edge Wealth Management, LLC. To the extent that a reader has any questions regarding the applicability of any specific issue discussed above to his/her individual situation, he/she is encouraged to consult with the professional advisor of his/her choosing. A copy of our current written disclosure statement discussing our advisory services and fees is available for review upon request.