U.S. Yield Curve Approaching Full Inversion
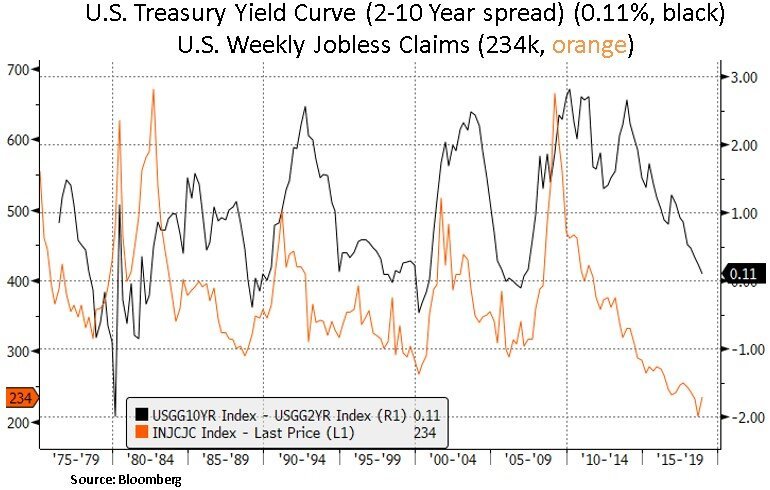
The U.S. Treasury yield curve is now the flattest since the great financial crisis (GFC) ended. Portions of the front- end of the curve have started inverting e.g. the 3-5 Year yield spread has recently dropped below zero. Historically, yield curve inversions have signaled that Federal Reserve policy is too tight. The long-end of the curve typically rallies as lower inflation expectations and lower future Fed interest rates are gradually priced in. A potential policy error also contributes to a higher risk of a growth and credit downturn; which in turn is a cyclical profit headwind for corporations. Given the historically elevated non-financial corporate debt we still see further credit spread widening in 2019. We note that historically there’s a material lag i.e. 12-18 months before an actual economic recession gets triggered. Asset prices such as U.S. equities and corporate bonds may now be on the cusp of gradually pricing in the risk of a 2020 U.S. recession. On average, high yield spreads tend to start widening two years ahead of the next downturn and tend to be 300-400bp wider just ahead of the recession’s start. The Fed’s narrative has recently started shifting by signally that a ‘neutral’ base rate may be ‘just below’ the range of market expectations. We expect the Fed’s policy expectations to converge towards market expectations of just one rate hike in 2019.
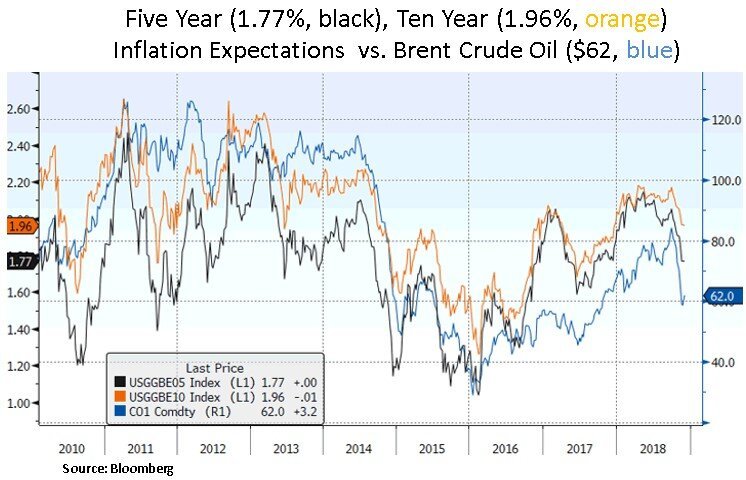
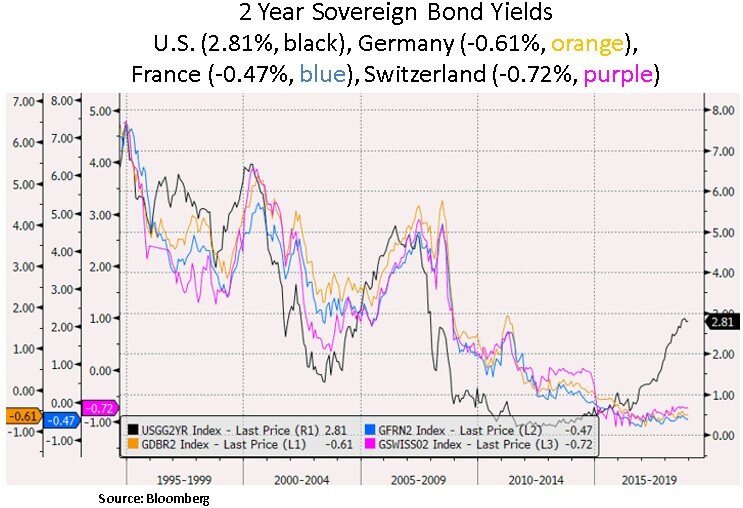
As discussed in our October commentary, we believe inflation expectations have peaked and we now expect tighter financial conditions to impact the U.S. labor market more meaningfully in 2019. We note the most recent pick-up in weekly jobless claims, which tends to correlate well with the shape of the yield curve. We also highlight below, that from a global sovereign yield perspective there is ample scope for yield convergence in 2019 and beyond. If one is to witness a deterioration in the U.S. labor market, one would need to see an imminent spike in jobless claims. Historically, there was never a U.S. downturn without jobless claims spiking 10% or more, on a Q-Q basis.

Apart from the current Fed interest rate hiking cycle, quantitative tightening (QT) has also been a headwind for global liquidity conditions and risk sentiment. The Fed is now contracting its balance sheet at an annualized pace of $600bn. The Fed’s assets now stand at $4.1 trillion and the expectation is for a decrease to $2.5-3 trillion. Yield curve inversion in our view also takes into account this balance sheet unwinding i.e. a prospective liquidity draining of 1.5-2 trillion. Thus far in 2018, U.S. growth divergence, the Fed’s hiking resolve and the U.S. corporate repatriation theme have boosted the USD, especially vs. emerging market currencies. This contributed to the global cost of borrowing rising. As we can see below, key money supply growth rates have been decelerating. In our view, a softer global growth and inflation outlook may eventually restrain the global central banks from fully withdrawing liquidity.
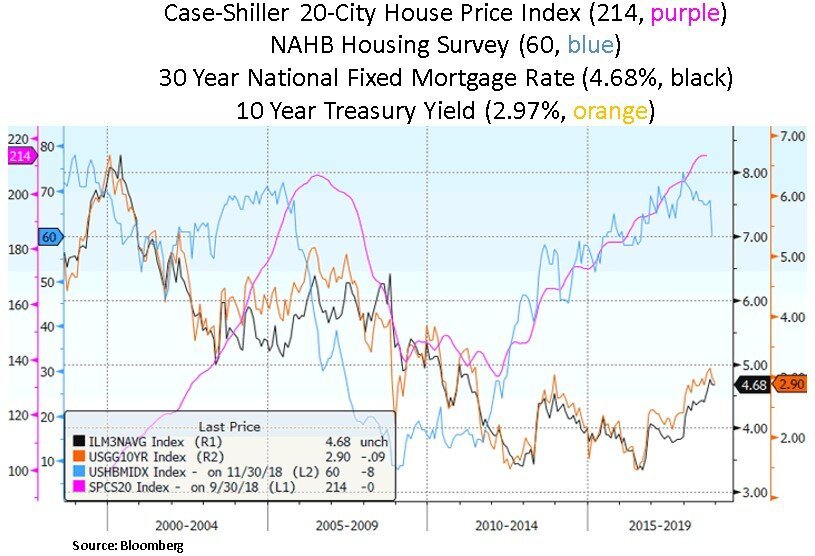
From our portfolio perspective, we remain highly selective with a continued focus on security valuations, income generation and quality large-cap balance sheets. We continue to avoid highly indebted companies with questionable earnings profiles and companies that have riskier cyclical exposure e.g. homebuilders, autos, semiconductors, chemicals.


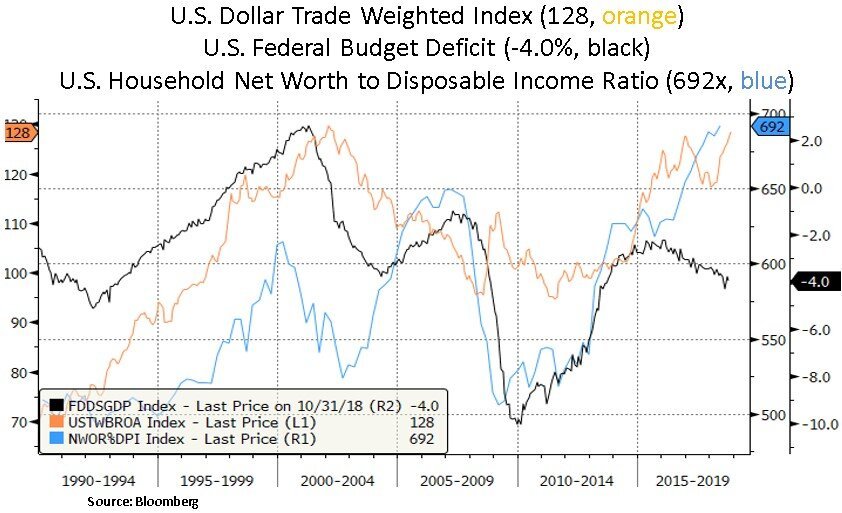
Lastly, we believe 2019 may see an inflection point in the U.S. dollar as we should see a renewed focus on growing U.S. budget deficits. If Treasury yields are not high enough to compensate for these widening deficits, a lower currency may be needed to entice buyers. Fundamentally, a growth re-convergence between the U.S. and rest of the world will likely lead to narrower interest rate differentials. Moreover, capital repatriation by other countries (e.g. Japanese pension funds) may weigh on the USD. In addition, as we can see below, measures such as household net worth to disposable income ratio are at historical highs. If U.S. growth decelerates materially, capital outflows from U.S. assets will likely be a headwind for the USD. In our view, a lower dollar and eventually lower U.S. interest rates will help fuel the next cyclical upturn for global growth and at that juncture we would likely be more aggressive buyers of internationally exposed U.S. corporations e.g. tech, industrials, energy.
In conclusion, we are currently at a pivotal point in the Treasury yield curve which is approaching full inversion. In our view, yield curve inversion is signaling an overly restraining Fed policy and a lower growth/inflation outlook in 2019-2020. We continue to remain selective and opportunistic in our asset allocation. We look to take advantage of further bouts of volatility in 2019 via our ample cash weighting, as the U.S. growth and profit cycles face increasing uncertainty.
Christos Charalambous CFA
Senior Strategist
christos.charalambous@edgewealth.com
Please remember that past performance may not be indicative of future results. Different types of investments involve varying degrees of risk, and there can be no assurance that the future performance of any specific investment, investment strategy, or product made reference to directly or indirectly in this newsletter (article), will be profitable, equal any corresponding indicated historical performance level(s), or be suitable for your portfolio. Due to various factors, including changing market conditions, the content may no longer be reflective of current opinions or positions. Moreover, you should not assume that any discussion or information contained in this newsletter (article) serves as the receipt of, or as a substitute for, personalized investment advice from Edge Wealth Management, LLC. To the extent that a reader has any questions regarding the applicability of any specific issue discussed above to his/her individual situation, he/she is encouraged to consult with the professional advisor of his/her choosing. A copy of our current written disclosure statement discussing our advisory services and fees is available for review upon request.